Most "AR try-on" stories stop at the product page. We've been running the math on the whole funnel.
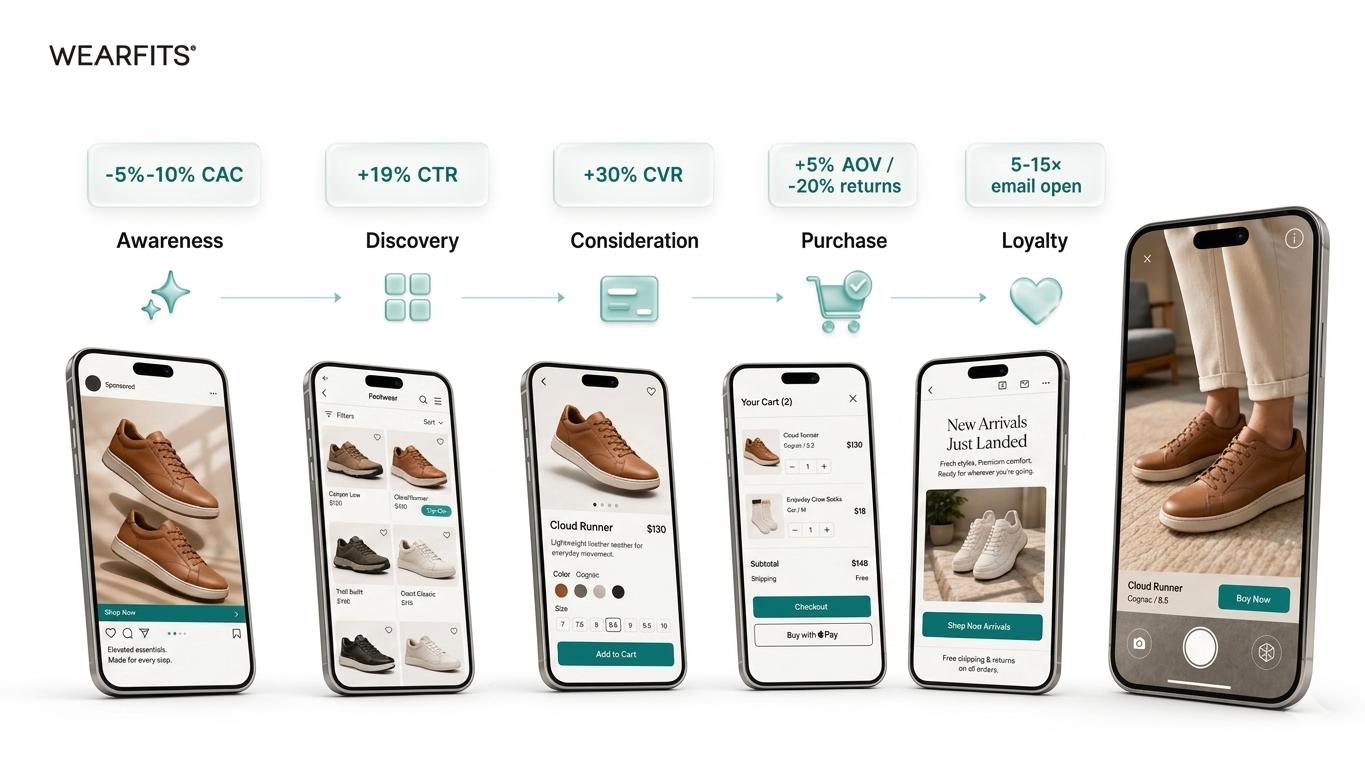
WEARFITS plugs into every stage of the e-commerce funnel — awareness, discovery, consideration, purchase, and loyalty. Each stage moves a different metric. Here's where AR actually pays back, with the numbers your CFO will want to see.


Your GMV isn't bleeding out in one place. It's bleeding out in five.
Every fashion brand watches the same monthly dashboard. Revenue. GMV. CAC. Conversion rate. Return rate. The numbers move a few points either way, and the team chalks it up to “ad costs are tough this quarter” or “returns are seasonal.”
That story is comforting, but it isn’t true.
Your GMV is leaking — quietly, predictably — at every stage of the funnel. Hidden stage performance you can’t see in your dashboard, because no team owns the gap between stages. Marketing owns CAC. Merch owns the PLP. CRO owns the PDP. Operations owns returns. Retention owns repeat. Nobody owns the loss between them — and that’s where most of the revenue lives.
The standard playbook is to fix each stage in isolation. New ad creative. A redesigned PLP. A bigger discount on the PDP. A tighter return policy. Each of these is hard, expensive, and slow — and the math gets worse every year.
WEARFITS plugs into all five stages of the funnel — and lifts the metric each one owns.
Not as a marketing claim. As the actual structure of what virtual try-on for shoes, bags, and apparel does to your funnel:
- Awareness — lower CAC
- Discovery — higher PLP click-through
- Consideration — higher PDP conversion
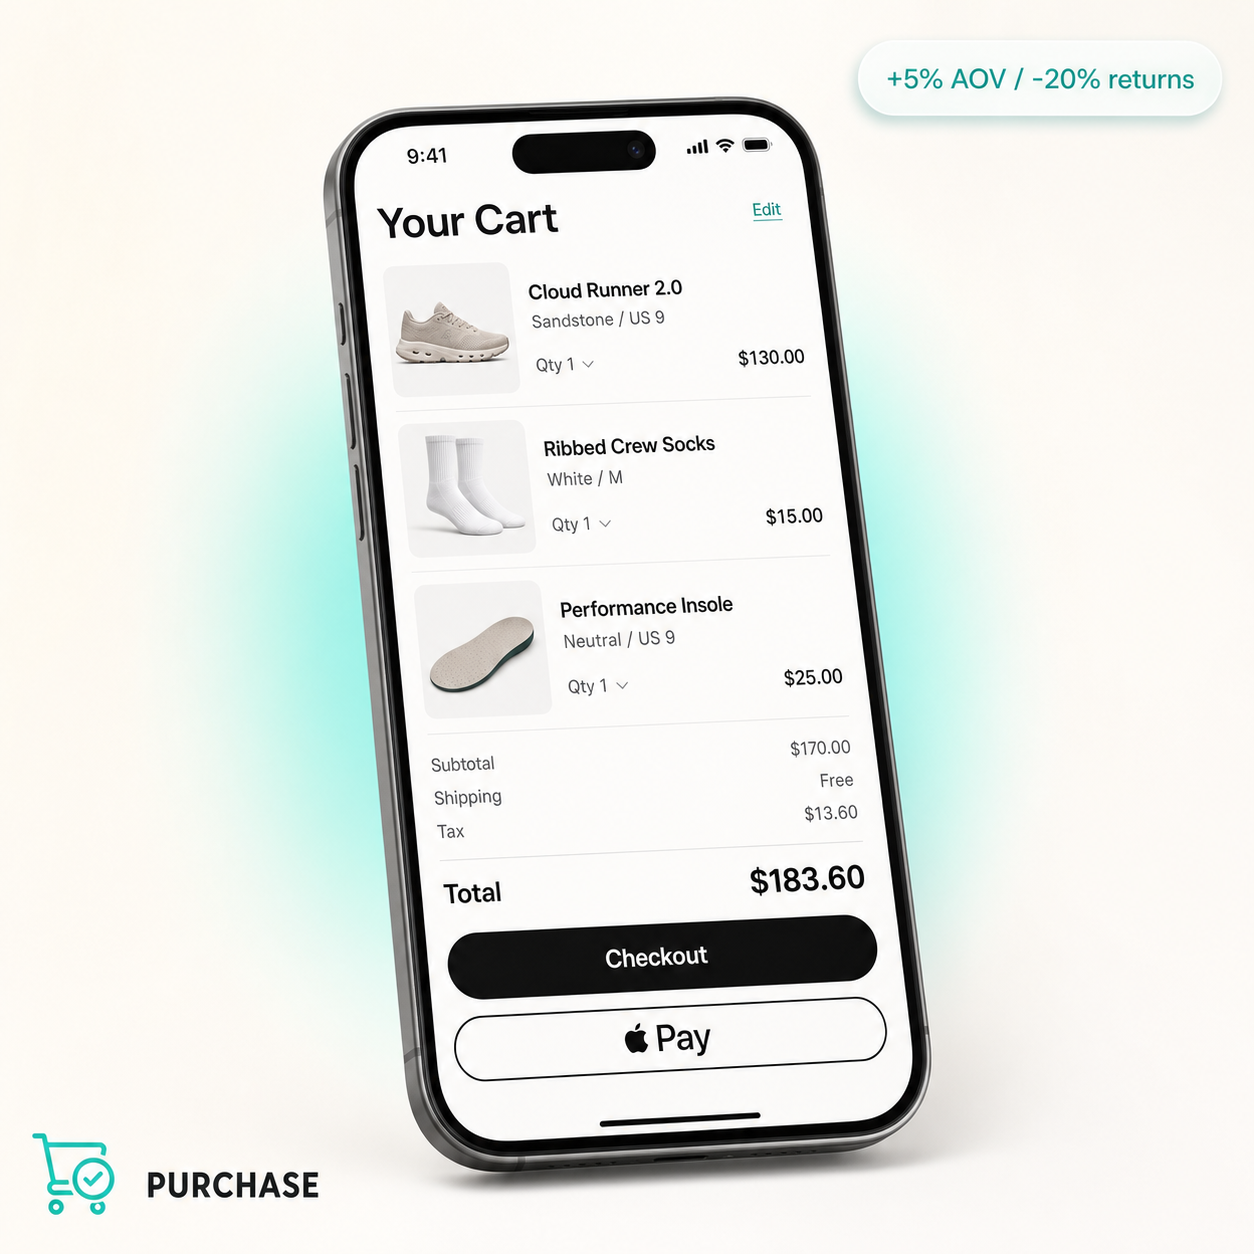
- Purchase — higher AOV, lower returns
- Loyalty — higher new-drop conversion via CRM
Below is the map, with the metric each stage moves — followed by an interactive calculator so you can size your own hidden GMV leak in 30 seconds.
Where WEARFITS plugs in (and what it moves)
One row per stage. Hero number per stage. Math behind each number is one click away.
-
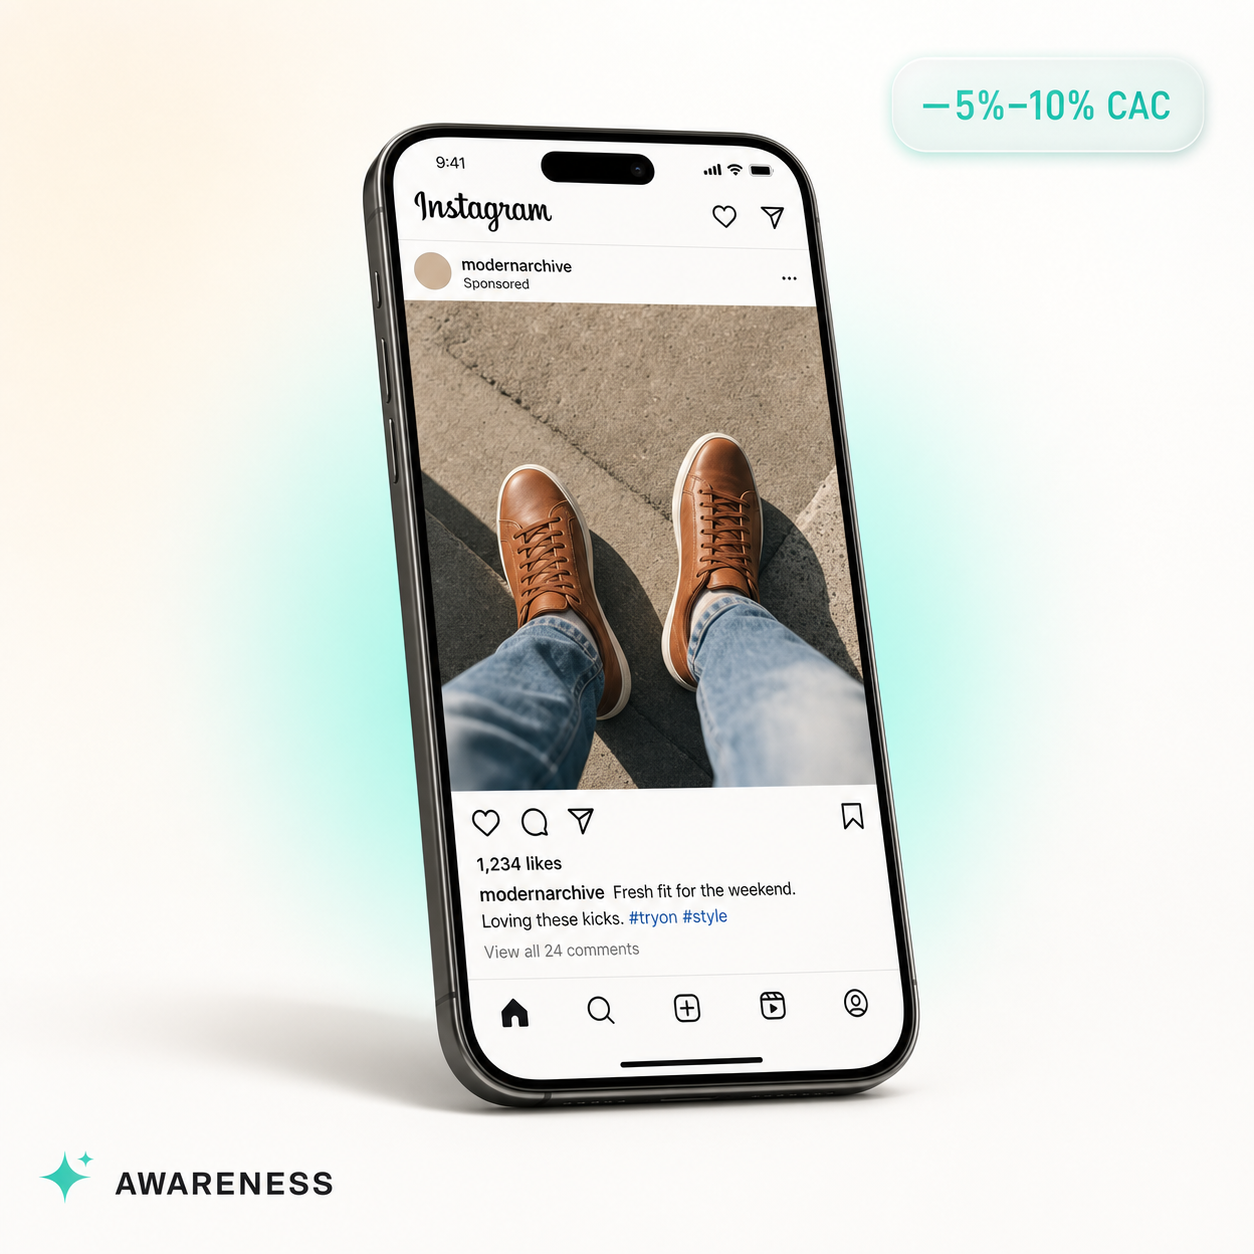
−5–10% CAC
Awareness
CAC
-
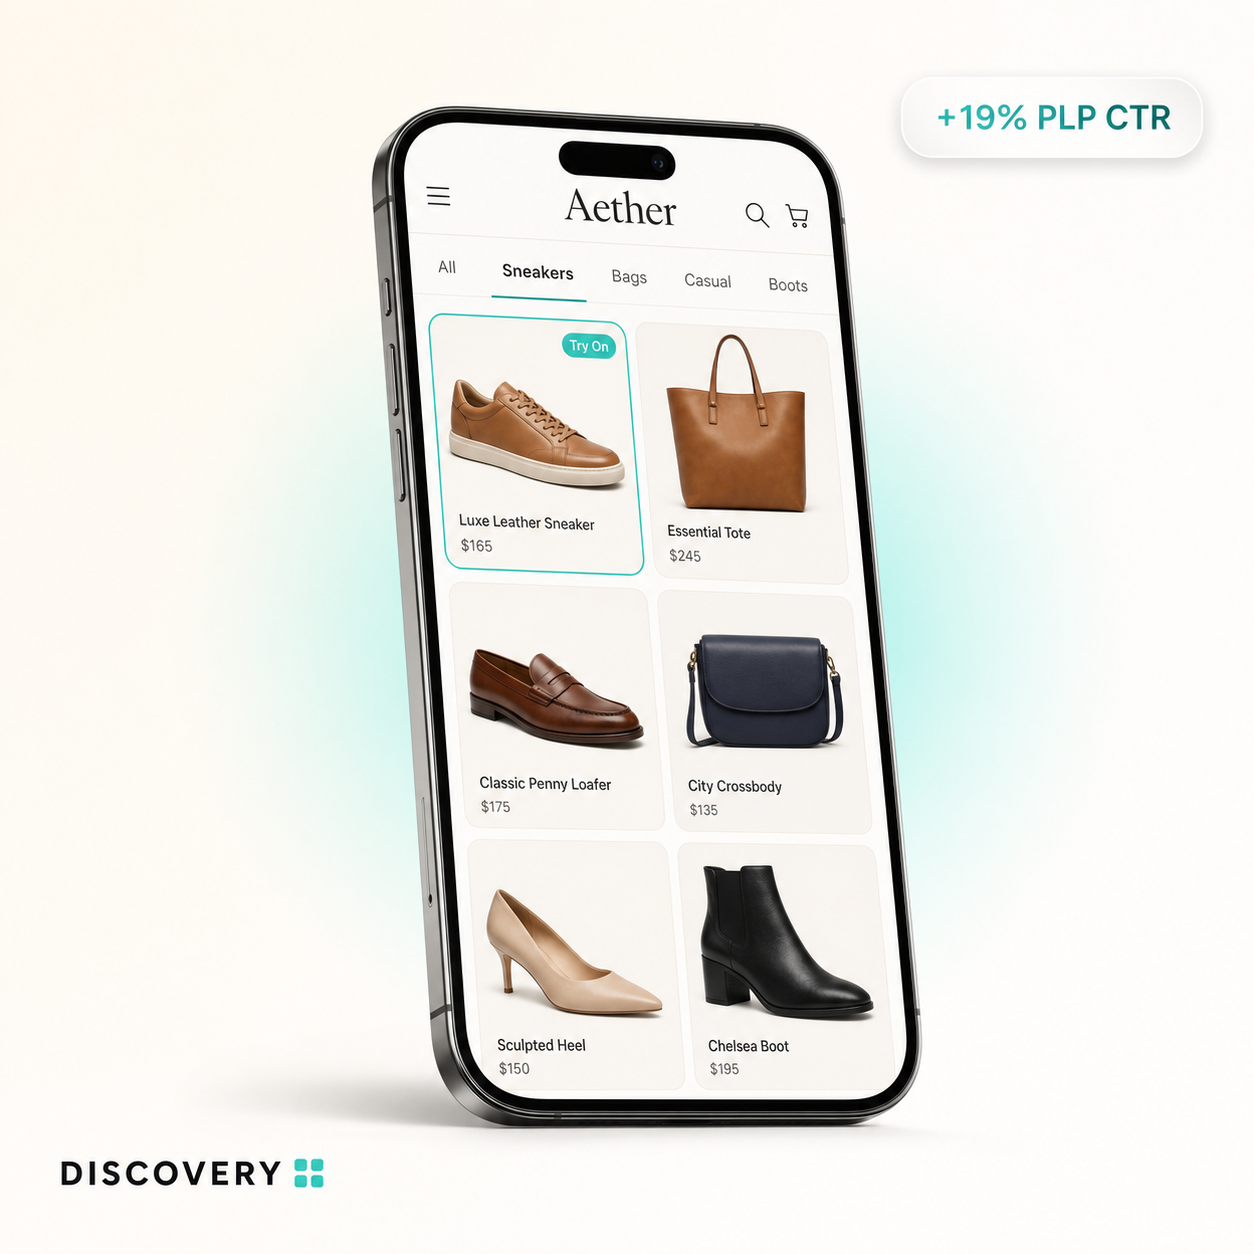
+19% CTR
Discovery
PLP CTR
-
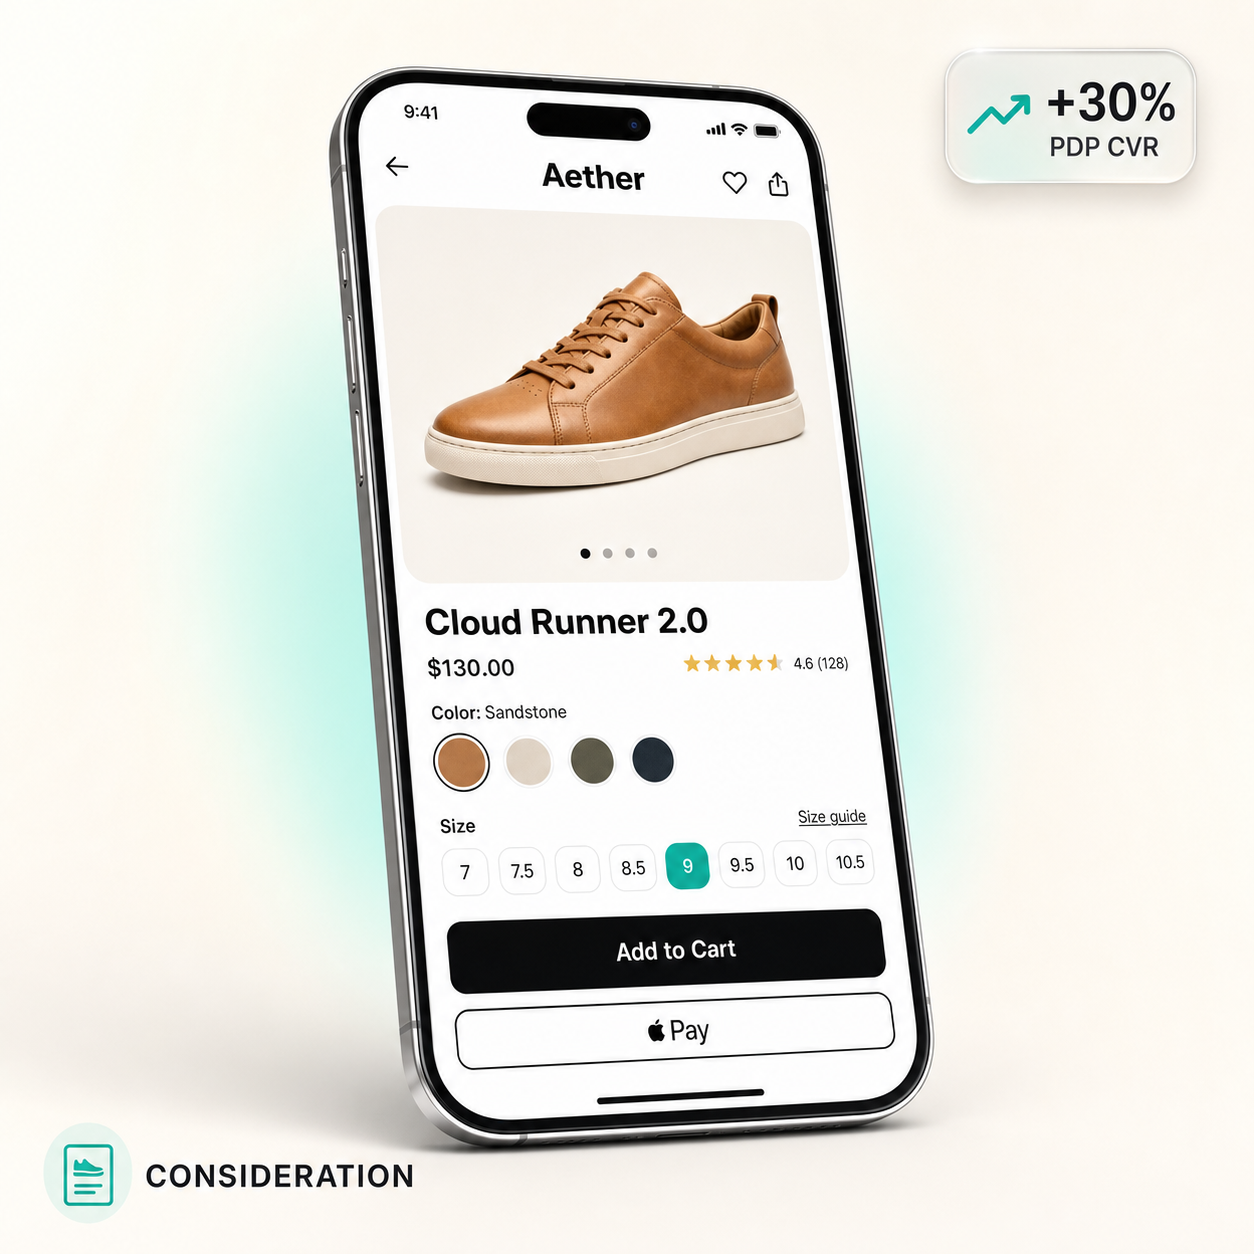
+30% CVR
Consideration
PDP CVR
-
+5% AOV / −20% returns
Purchase
AOV & Returns
-
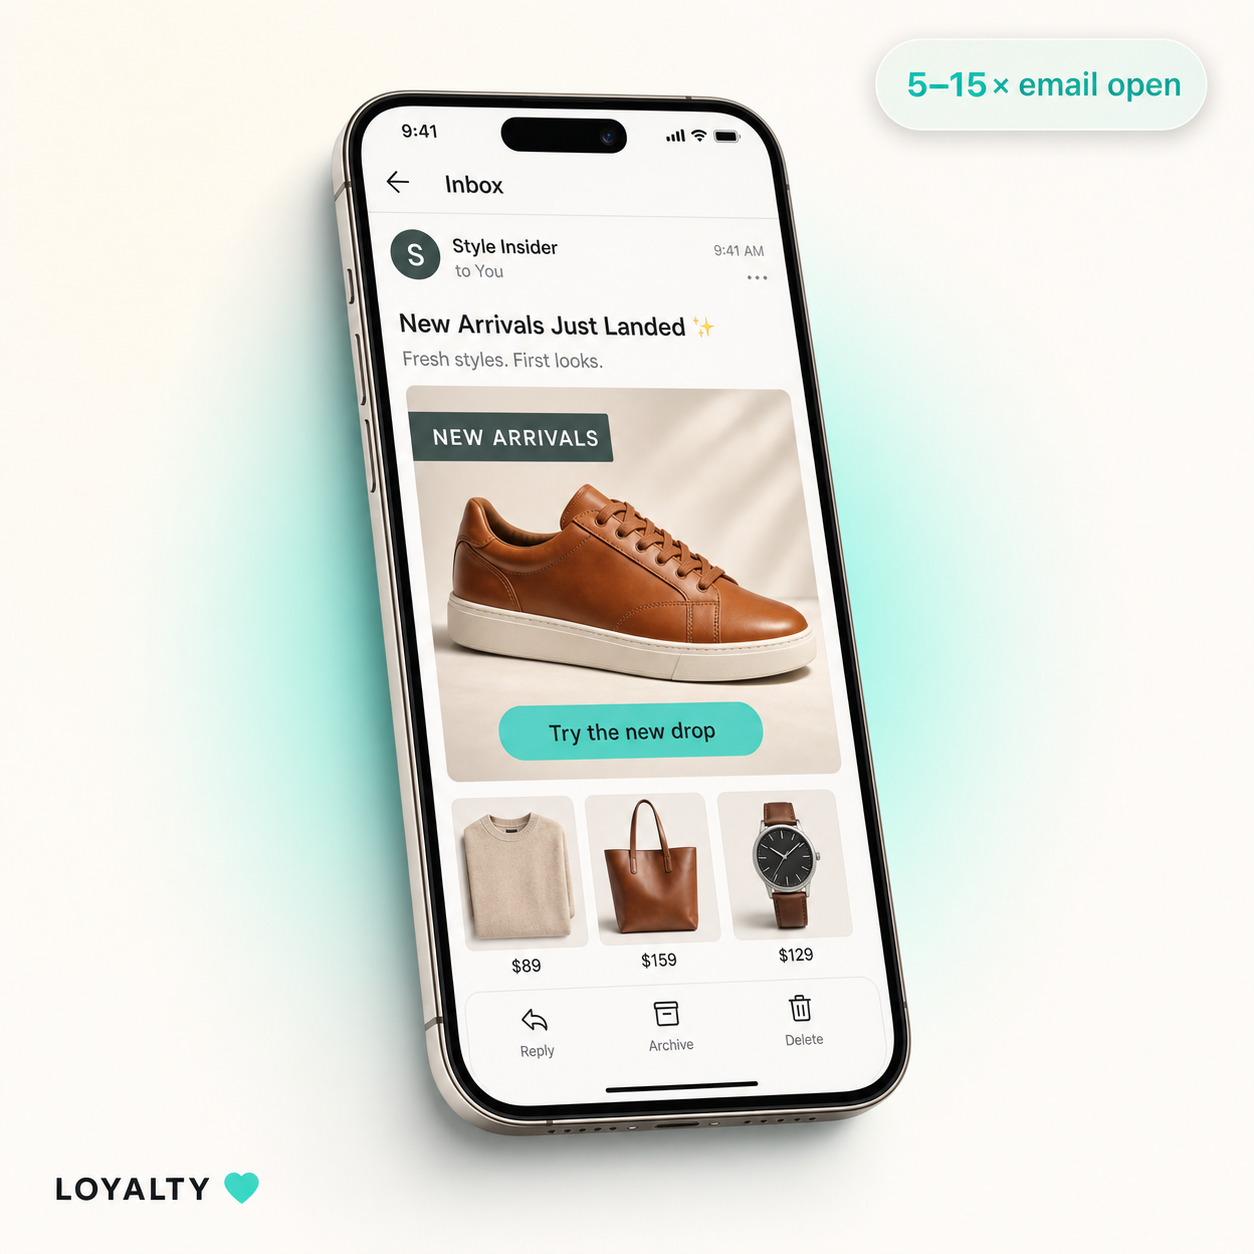
5–15× email open
Loyalty
Repeat purchase
The metric — Cost per acquisition (CAC)
Up to 5–10% lower blended CAC
At the awareness stage, attention is the currency. Static product photos and scripted brand content compete with millions of equivalent posts. A try-on session, on the other hand, is a piece of UGC waiting to happen — customers share themselves trying on the new drop. That UGC enters your acquisition funnel as organic content with stronger conversion than paid creative, lowering blended CAC by 5–10% over time. Fashion CAC sits at $66–$129 per customer in 2026; even a 5% lift on the lower end is meaningful budget. (Retainful 2026 CAC benchmark)
The metric — Product listing page (PLP) click-through rate
+19% CTR on PLPs with a "Try On" badge
Discovery is the stage almost no one measures cleanly. Your shoppers land on a category page or PLP grid, scan a wall of product cards, and click into one. Every shopper who scrolls past your hero SKU without clicking is a lost conversion you never billed. WEARFITS-enabled PLP rows tag products with a "Try On" badge. The Farfetch × WANNA case study reported a 19% lift in CTR on PLP rows with the Try On label. That is a free conversion lever on top of your existing ad and SEO traffic — no CAC change required.
The metric — Product detail page (PDP) conversion rate
Conversion rate up to 30% higher on AR-enabled PDPs
This is the stage everyone optimizes and the stage that has the most ceiling. Shopify's 2026 fashion benchmarks put the average store at 1.4–1.8% conversion. The structural reason for the ceiling is that a static photo asks the customer "do I like this shoe in a photo?" — which the brain answers in 7 seconds. A try-on session changes the question to "do I like this shoe on me?" — a much harder question to dismiss and a much better predictor of purchase. Stanford's AR research backs this up: augmented reality shifts purchase intent and increases time-on-task. On AR-enabled PDPs, conversion typically lifts up to 30%.
The metric — Average order value (AOV) + post-purchase return rate
Up to +5% AOV at purchase, up to −20% returns after delivery
Purchase is two metrics, not one. There's what the customer pays at checkout (AOV — driven by add-to-bag rate and add-on conversion), and there's what stays bought after delivery (return rate). WEARFITS moves both. The Farfetch × WANNA implementation reported +5% add-to-bag on AR-enabled products — customers seeing themselves in the shoe also see themselves in a second pair. Post-delivery, returns typically drop 20% because "I thought it would look different" is the largest single return reason in fashion, and AR removes it.
For DTC shoe brands specifically, online returns sit around 18% and cost $15–$25 per pair in processing plus 20–30% unresellable inventory. A 20% reduction is the single largest dollar lever in the funnel.
The metric — Repeat purchase rate (RPR) + new-drop conversion
A second-purchase try-on link converts a fraction of your CRM list on every new drop — typically 5–15× the open rate of a standard new-product email
Most fashion brands stop talking about virtual try-on after the first purchase. We think that's the biggest miss in the category. Here's why.
A repeat purchase in fashion is a confidence game. A returning customer knows your brand, your shipping, your return policy — but doesn't yet know whether the new drop is them. The single highest-converting answer to "is this new SKU me?" is a try-on link, delivered to the customer who already bought from you.
That's what we mean by new drops try-on, distributed via CRM. When you drop a new model, your Klaviyo or HubSpot CRM doesn't send a static product photo. It sends a one-tap try-on link. The customer sees themselves in the new SKU in 30 seconds, on their phone, without leaving the email. That converts at multiples of a standard new-drop email open rate, and it does so on a list that already trusts you.
The second loyalty lever is referral and social. A try-on session is sharable in a way that a product photo is not. Customers post them. New customers acquired through those shared sessions arrive with a built-in expectation of how the product will look on them — which means they convert faster and return less.
- A try-on link your CRM can ship in every new-drop email or SMS — the same digital twin used on the PDP, reused for retention with no extra production cost
- A sharable try-on session that customers post organically, feeding back into Stage 1 (awareness) and closing the loop
Run your own numbers
Three inputs. We model the annual impact across the funnel. No form to fill, no email gate.
Show the per-stage breakdown
Modeled at 50% DTC gross margin. Discounts applied for adoption ramp, channel dedupe, and real-world variance. Treat as directional — we'll model your specific brand on a 20-minute call.
This is not the AR demo you saw in 2019
The category got built on demos. Native SDKs on flagship phones at trade shows. Beautiful in controlled conditions. Slow to deploy. Expensive per SKU. And usually parked on the PDP, which is one stage of five.
WEARFITS is built differently. Web-first, so one integration covers your storefront, mobile browsers, in-app WebViews, iframes, and in-store mirrors. Photo-to-3D, so you send packshots and the AI builds the digital twin — no CAD files, no per-asset modeling fee. Funnel-aware, so the same digital twin powers your PDP, your PLP badge, your CRM new-drop link, and your retail screen.
The result: integrate once, deploy everywhere, and run AR across the whole funnel — not just the product page.
- One native build per platform — iOS, Android, web duplicated
- CAD or 3D scan required per SKU; per-asset modeling fees
- Lives on the PDP; rarely reused across PLP, CRM, or retail
- One web integration covers storefront, WebView, iframe, in-store mirror
- Packshots in → AI digital twin out; no CAD, no per-asset fee
- Same digital twin powers PDP, PLP badge, CRM link, and retail screen
Production numbers, not demo numbers.
From live deployments across CCC, Converse, Hockerty, and a major European fashion retailer.
Conversion lift, typical
On AR-enabled PDPs, with realistic try-on across the full catalog — not just hero SKUs.
Returns reduction, typical
"I thought it would look different" is the largest return reason in fashion. AR removes it.
PLP click-through rate
Farfetch × WANNA case study: products tagged with a "Try On" badge saw a 19% CTR lift.
Try-ons in a single month
One major European fashion retailer ran over a million sessions on production traffic.
Three integration paths, one product.
Same digital twin, same engine. Pick the integration that fits your stack — switch later if you need to.
Shopify App Store
For shoe brands on Shopify Basic through Plus. Install, send packshots, your AI digital twin is live in hours. 14-day free trial.
See WEARFITS for Shopify →Web modules
An iframe and a JavaScript modal for headless storefronts and custom builds. One to two developer-days to a live PDP.
Talk to engineering →Headless REST API
Full UI control across web, mobile, and in-store. The same digital twin powers every channel.
Request API docs →Common questions.
If we haven't answered something, book a 20-minute call — we'll model your funnel live.
Does WEARFITS work across the whole funnel, or just the PDP?
The whole funnel. The same digital twin you build for the PDP also powers the PLP badge, the CRM new-drop link, the in-store mirror, and the sharable session.
How do you actually distribute a try-on link via CRM?
The link is a standard URL. Klaviyo, HubSpot, Mailchimp, or any other CRM that sends email or SMS can include it. Open rates and click-through are tracked by your existing tools — we don't add a separate tracking layer.
What's the difference between WEARFITS and a competitor like Auglio or WANNA?
Web-first instead of native SDKs; photo-to-3D instead of per-asset modeling; one integration across all channels instead of separate SDK builds. The detailed comparison is on our Shopify shoes LP.
How fast can we go live?
Shopify Basic: a few hours. Web modules on a headless storefront: 1–2 developer-days. Full API: 1–2 developer-days for a prototype, a week or two for a production-grade implementation.
Can we run a pilot before committing?
Yes. The standard pilot is one collection or hero SKU range, two weeks live, measured against a control set of products without AR. The conversion lift and return-rate change typically show inside 30 days.
Run AR across the whole funnel, not just the product page.
We'll model your specific funnel, identify where AR moves the most margin, and show you the math. 20 minutes, no slides.