What AR Mirrors for Retail Mean for Inventory Management and Return Rate Reduction
In this article, we discuss how to select, integrate, and measure ROI of augmented reality mirrors to reduce returns and enhance in-store data collection. We explain the transition of AR from novelty to critical infrastructure component that drives operational efficiency and competitive advantage.
Introduction
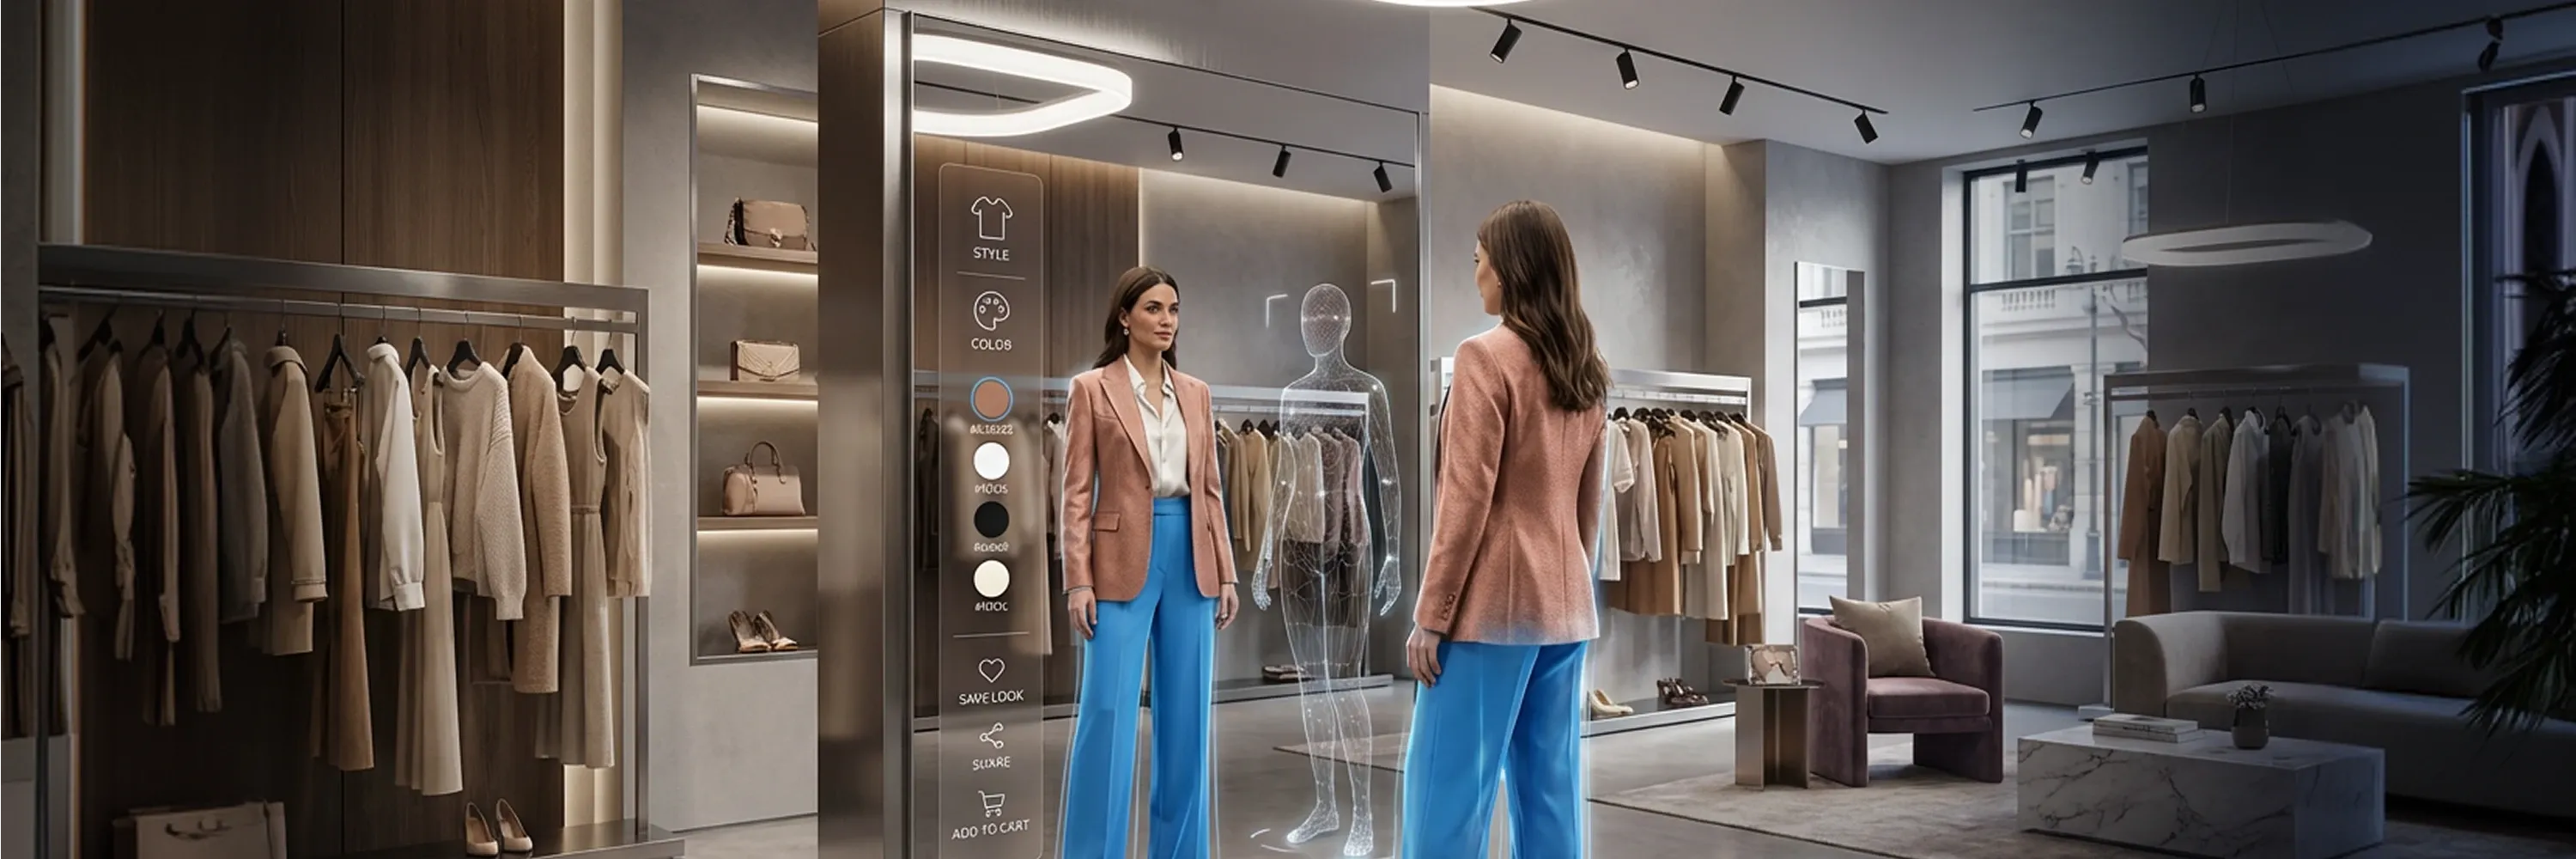
Physical retail faces a significant profitability challenge called the "returns crisis," especially within fashion and beauty sectors because styling uncertainty remains high. We cannot view in-store technology as mere entertainment anymore. We must evaluate technology based on its ability to solve this specific operational problem. AR mirrors for retail evolved from futuristic gimmicks into practical infrastructure solutions because 2026 technological advancements made them accessible.
We define AR mirrors for retail not as marketing toys but as data-gathering tools that actively correct purchase behavior before transaction occurs. Evidence shows that AR mirrors reduce returns by 25%-40% because they improve purchase accuracy. This improvement protects our bottom line. This guide moves beyond hype to show how we integrate these tools into an existing retail footprint to secure measurable data advantage.
Operational Business Case
We fail to secure this advantage when we view the technology incorrectly. We often mistake AR mirrors for retail as marketing novelties that solely entertain customers. This perception prevents us from realizing the technology's true value as a financial asset that protects revenue. We must present a strategic argument based on hard metrics rather than customer engagement levels when we justify the capital expenditure to the Chief Financial Officer. We specifically target two financial levers: sales uplift and return rate reduction.
The data supports this financial focus. For example, Sephora's AR mirrors achieved approximately 31% sales uplift, and users converted 90% higher than non-users. This increase happens because the mirror provides customers with the confidence they need to complete the purchase.
Beyond immediate sales, the technology functions as a long-term revenue driver. Industry analysis indicates that AR mirrors can achieve a 12%-25% revenue increase annually with a 3-8 month payback period. We secure operational efficiency when we deploy these mirrors to correct purchase behavior before the transaction occurs. This strategy significantly lowers the volume of costly returns.
Hardware and Software Selection
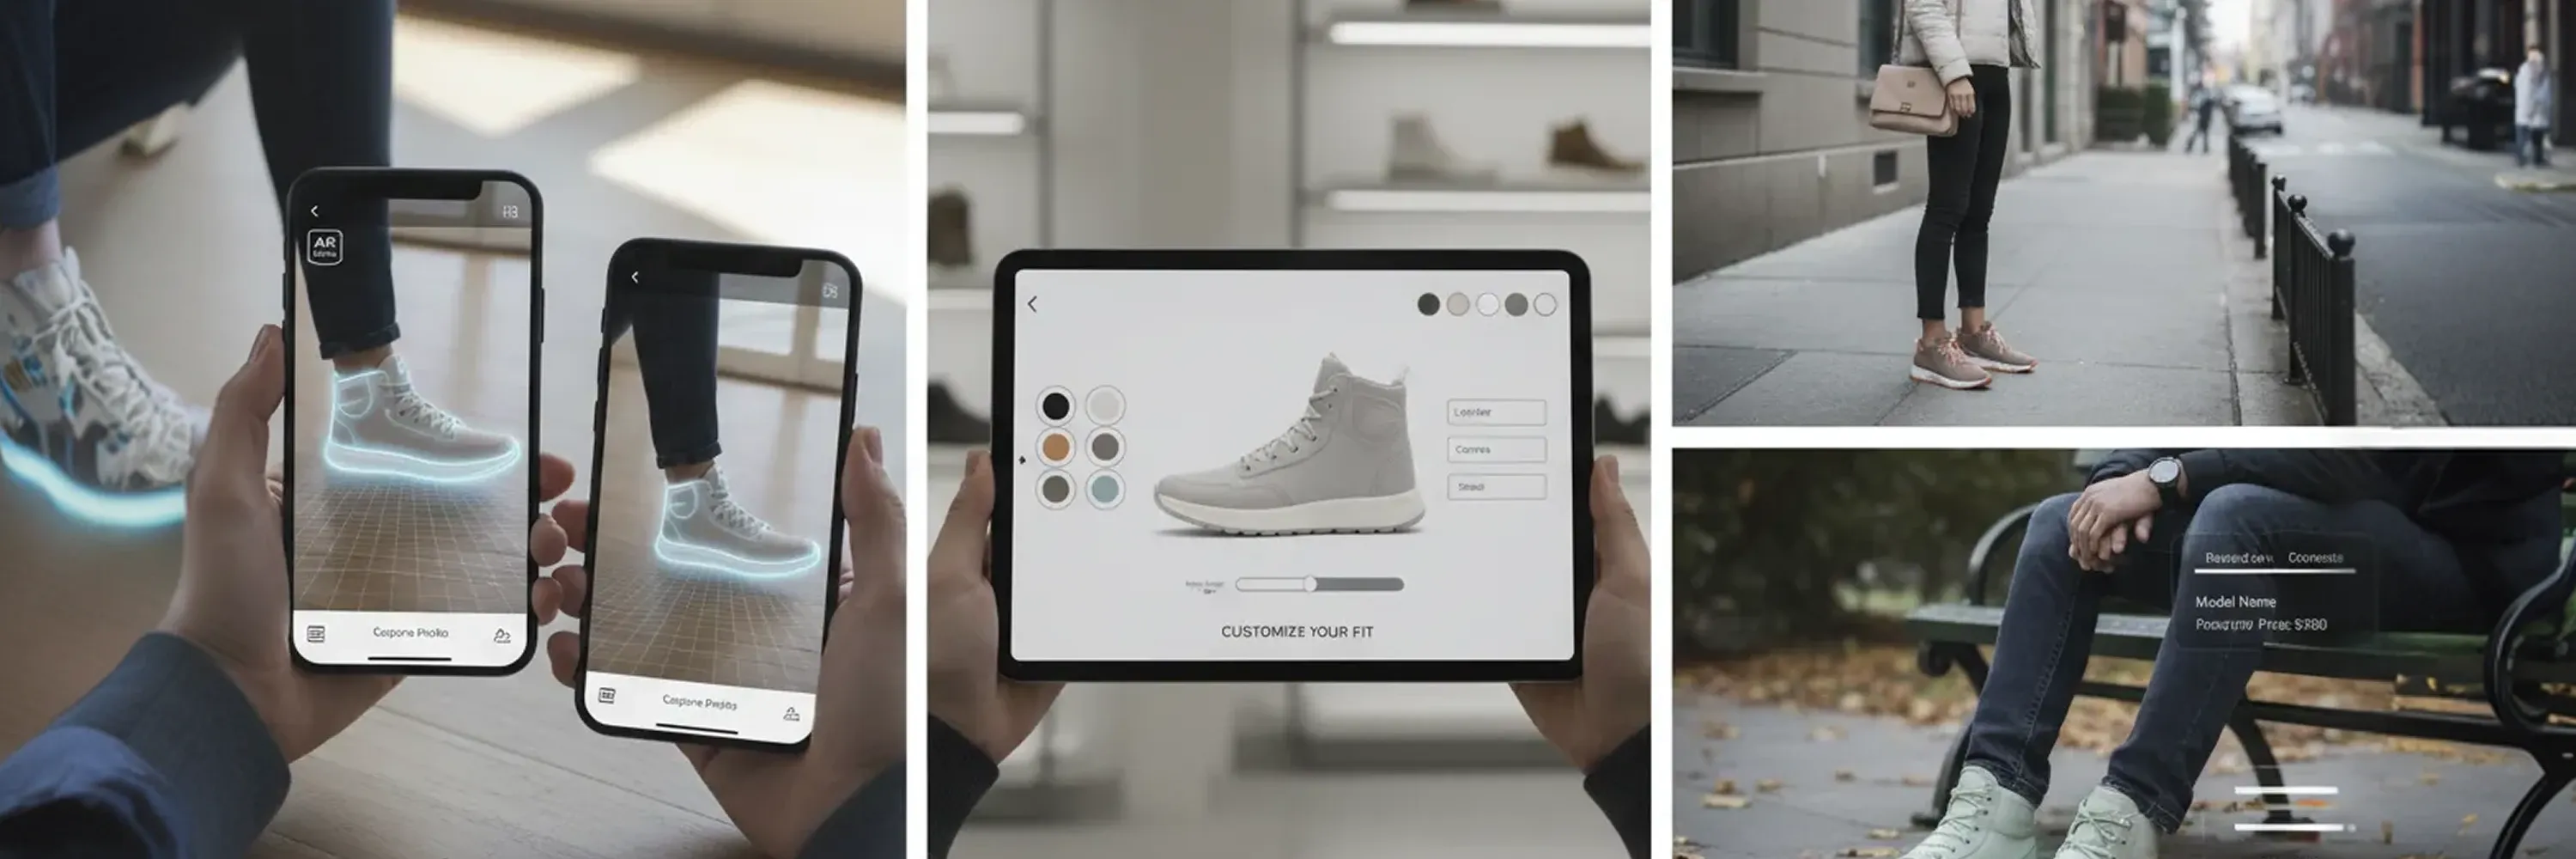
We lower these returns effectively only when we deploy the correct equipment. We face a critical decision when we select the physical form factor for our scalable virtual try-on strategy. The market offers a range of configurations, from immersive smart glass units to cost-effective tablet overlays.
We must treat this hardware not as a one-off display installation, but as scalable IT infrastructure that integrates with our existing store environments. The costs vary significantly depending on the fidelity and complexity of the interactive fitting mirror we choose to deploy.
We should consider the following cost estimates when building our budget:
-
AR mirror hardware entry price starts around $20,000 USD for a single fully deployed system.
-
Individual AR mirror units cost $380-$599 USD per unit when we purchase basic display components.
-
Simple marker-based AR app development ranges from $5,000 to $15,000, and this cost represents the software layer investment.
Smart Glass vs. Tablet Solutions
We must match the hardware complexity to the specific store tier. High-traffic flagship locations often justify the investment in full-length smart glass because these units drive brand prestige and handle high throughput. However, the costs for these premium installations are substantial. For instance, a full-scale smart mirror retail startup requires $2,100,000 initial capex to account for tooling and inventory.
For mid-market locations, we find that tablet-based solutions offer a viable alternative. These devices use the front-facing camera to create an interactive fitting mirror experience without the heavy footprint of a dedicated glass installation. Tablet solutions allow us to deploy the technology across hundreds of stores rapidly, and this closes the gap between digital capability and physical presence.
Build vs. Buy Decisions
We also need to decide whether to build a custom software application or license an existing platform. Building a proprietary app gives us total control, but it also burdens our internal IT teams with long-term maintenance. Licensing an established platform is often more efficient because it accelerates our speed to market and ensures constant software updates.
The costs for licensing can be high, but they replace the unpredictable expenses of internal development. For example, ModiFace AR integration licensing costs $200,000-$500,000 per year. While this fee appears steep, it provides immediate access to enterprise-grade tracking and rendering capabilities that would take years to develop in-house.
Content Bottleneck
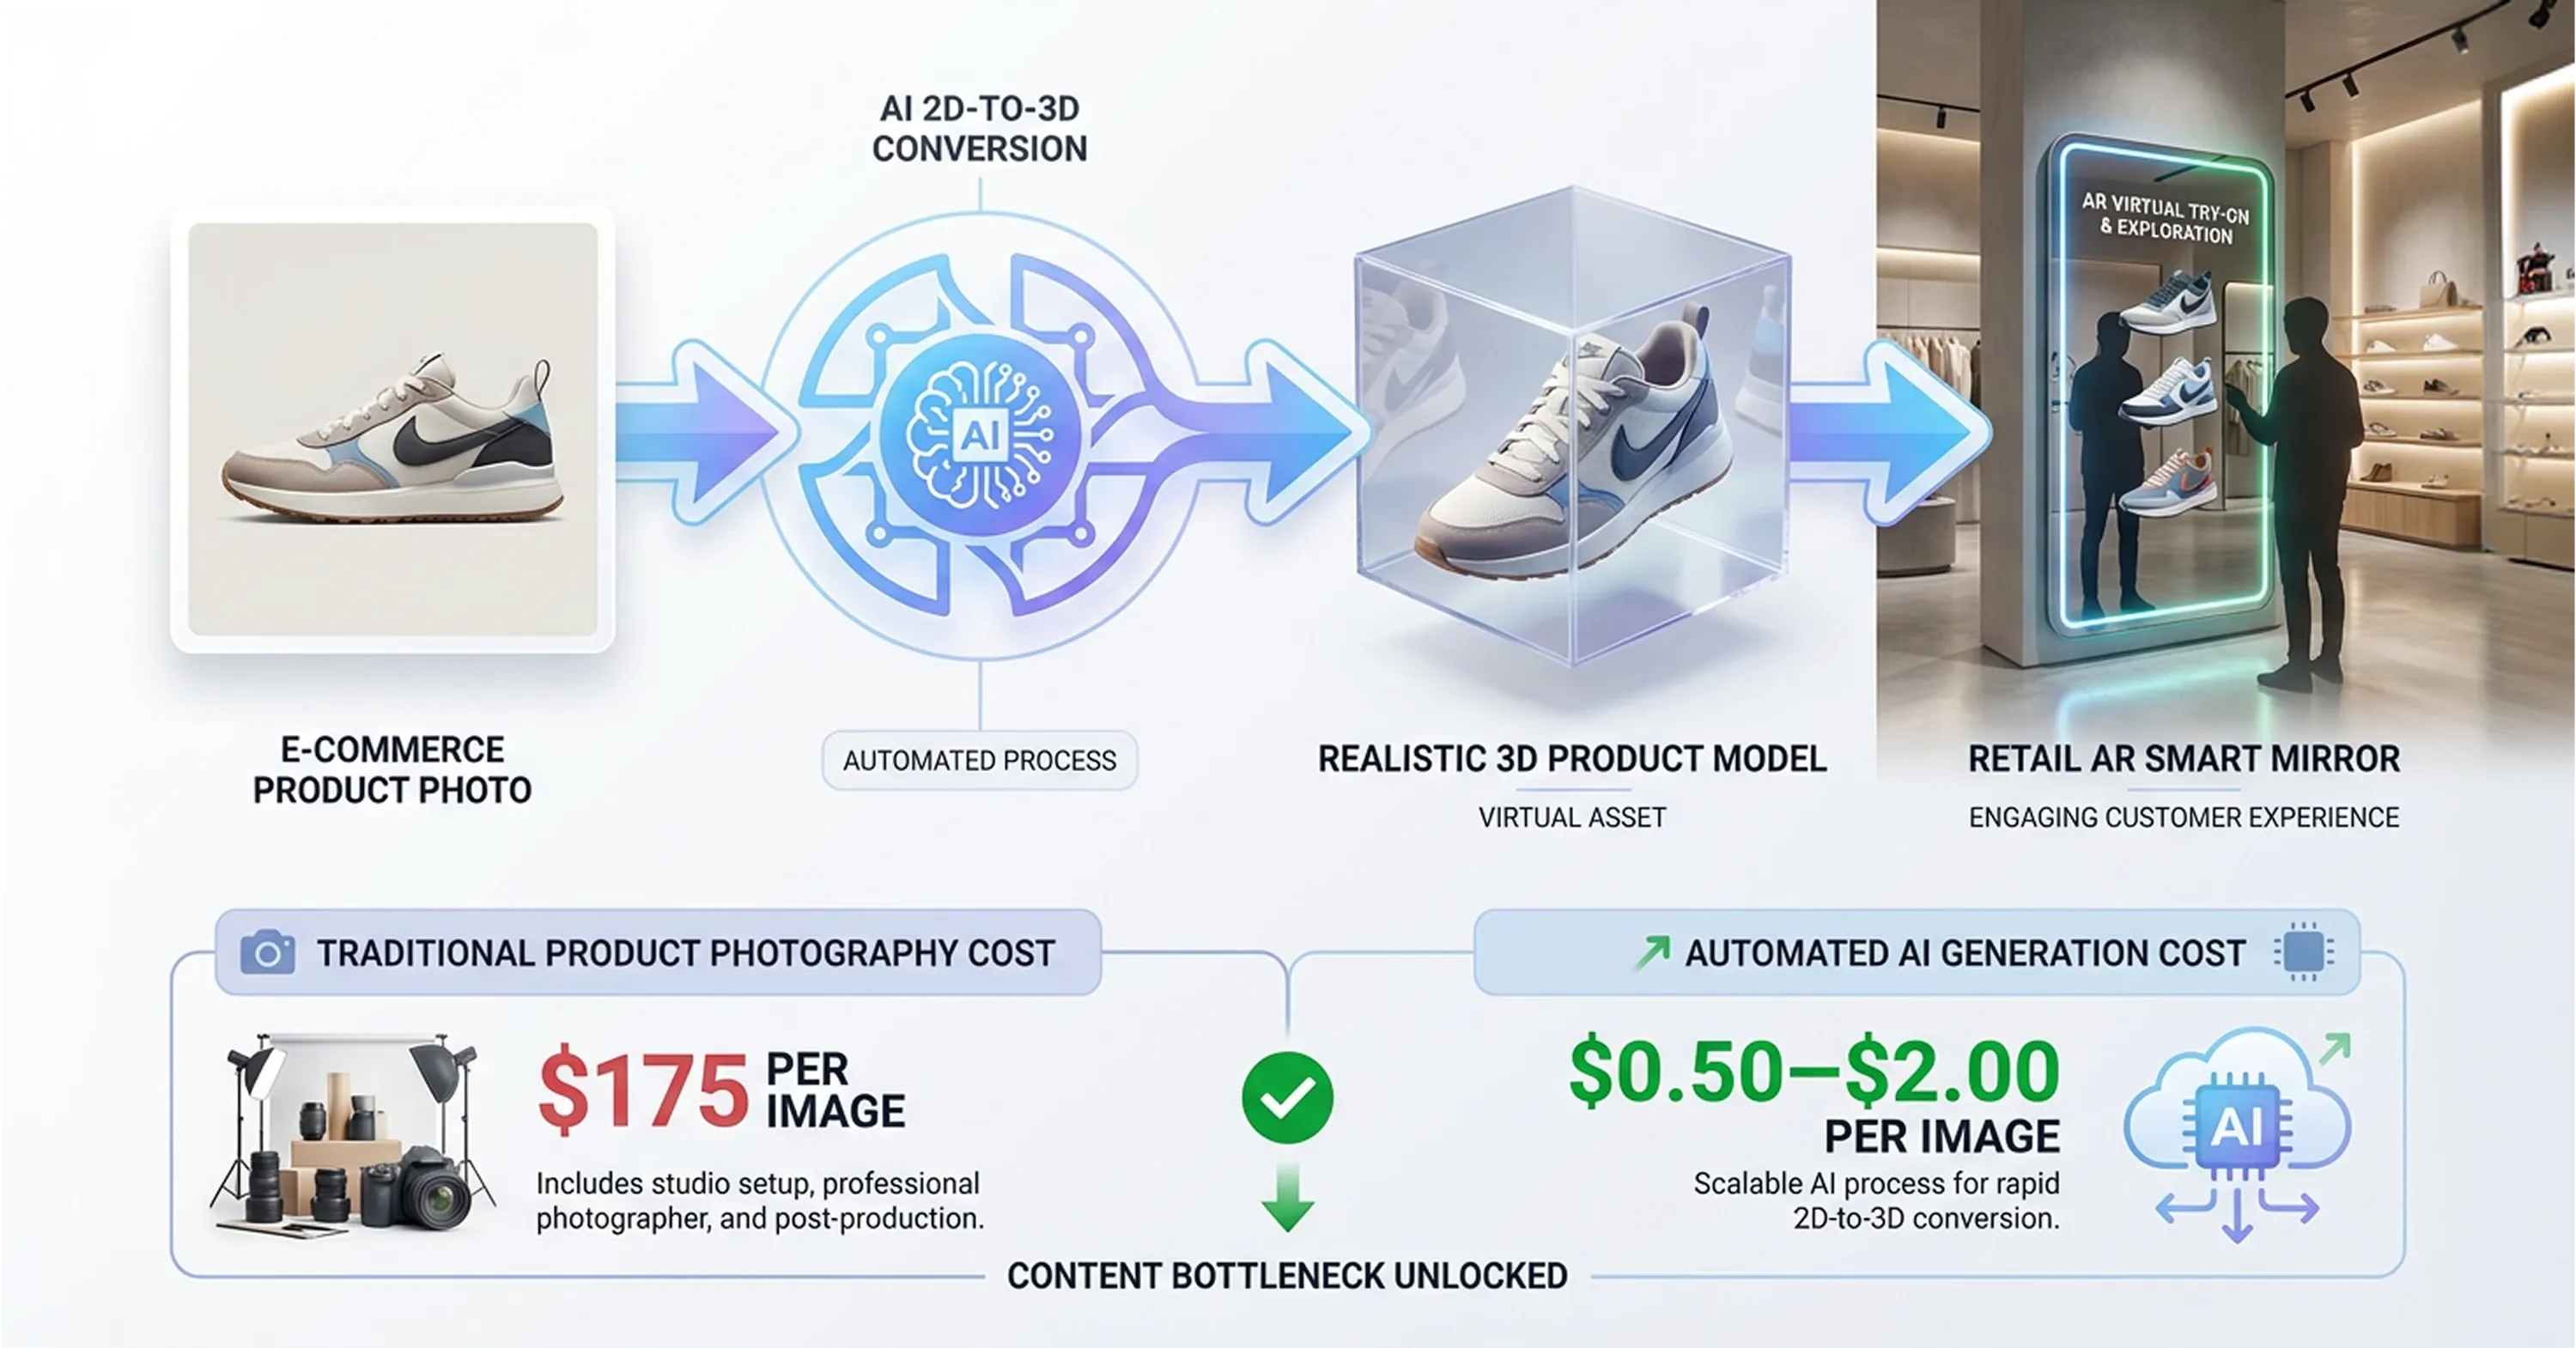
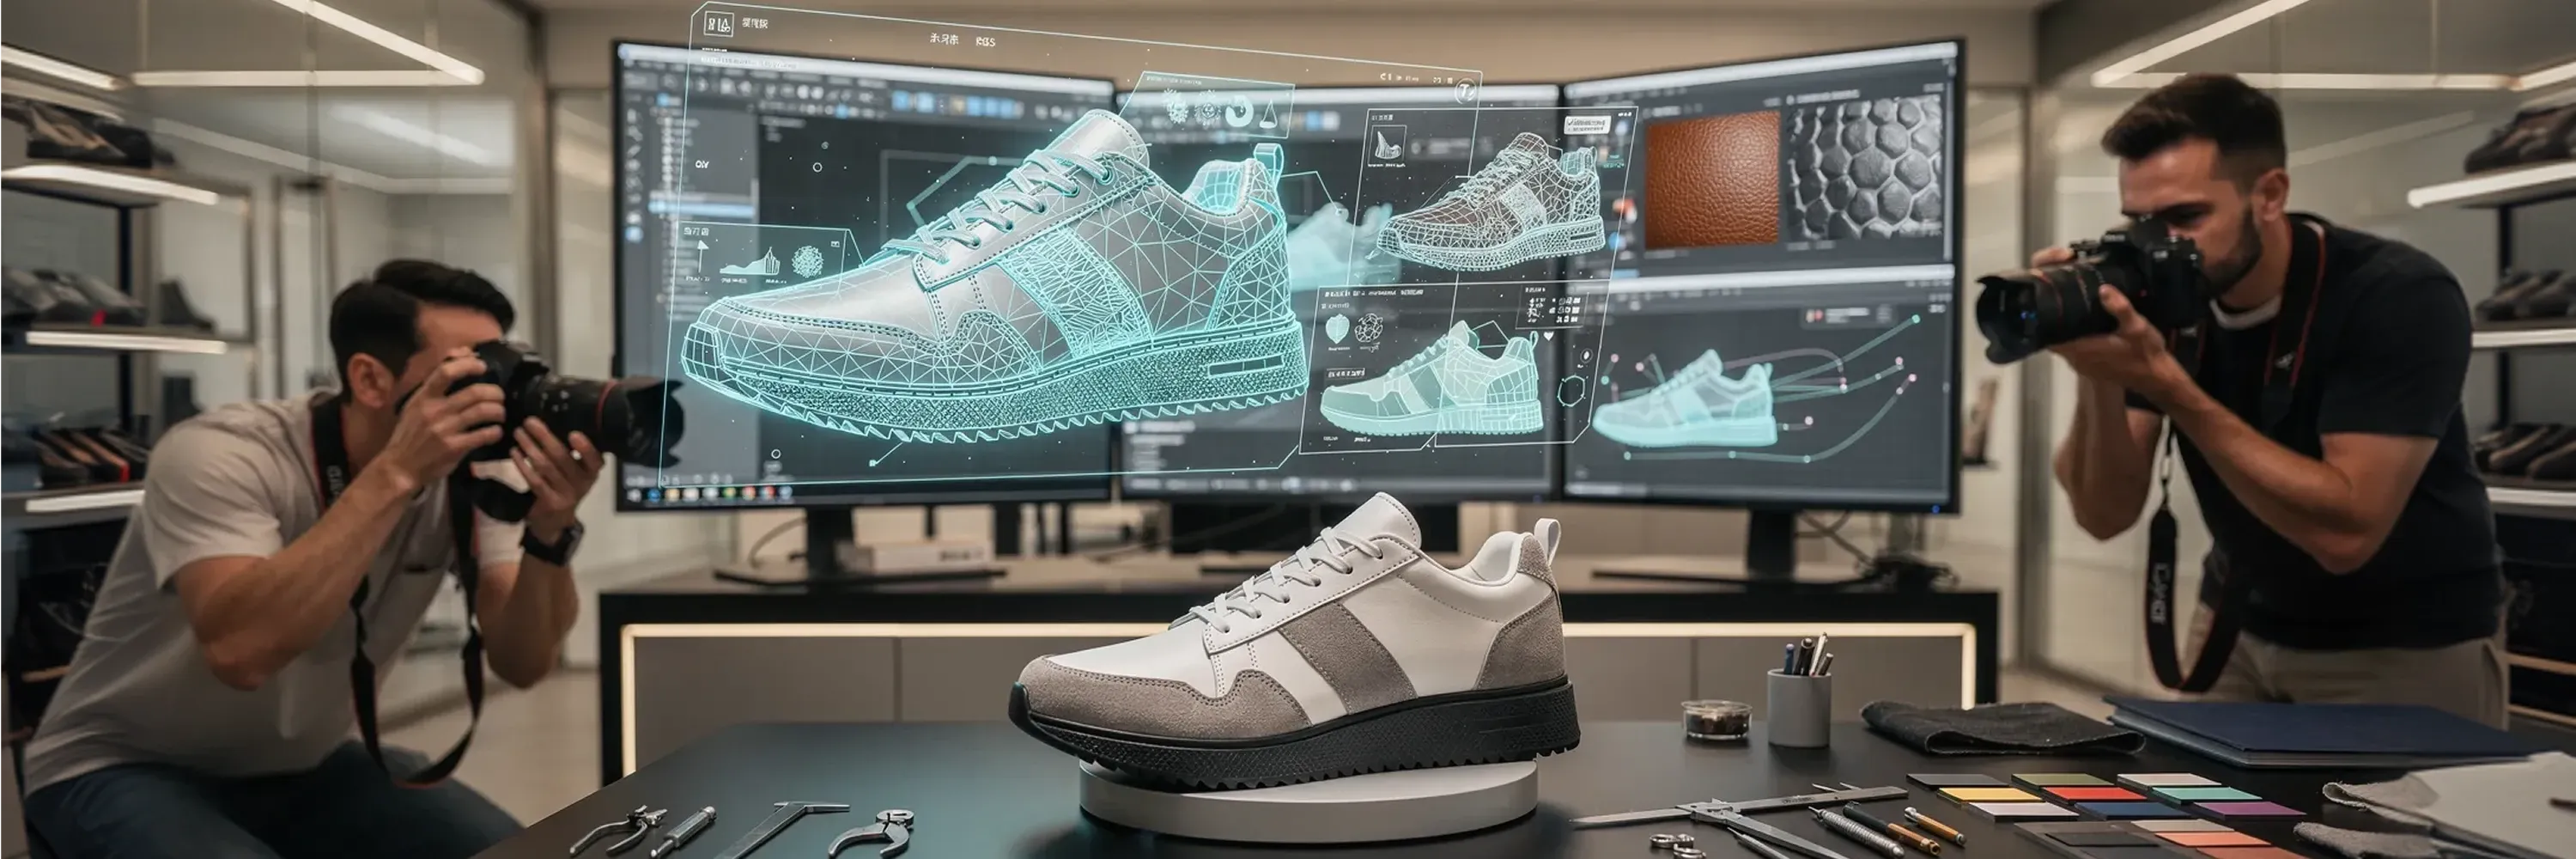
These platform capabilities require digital products to function. Historically, the high cost of creating 3D digital assets prevented us from deploying AR across our entire product catalog. We could only afford to digitize our best-sellers. However, new automated generation and 2D-to-3D conversion tools have made affordable 3D product digitization accessible to retailers of all sizes. These tools allow us to convert standard e-commerce photography into production-ready 3D models, and we do not need to hire expensive CAD teams.
The savings from these automated workflows improve the in-store AR experience. Real-world applications show dramatic cost reductions. For instance, Luna & Sage achieved an 80% cost reduction in annual product photography via automated image generation. This reduction brought their spend from $42,000 down to $8,400.
On a per-unit basis, automated product photography costs $0.50-$2.00 per image versus $175 per image via traditional photography. This efficiency allows us to digitize thousands of SKUs rapidly, and this ensures that our customers encounter a rich, fully stocked virtual inventory when they approach the mirror.
Integration with Legacy Systems
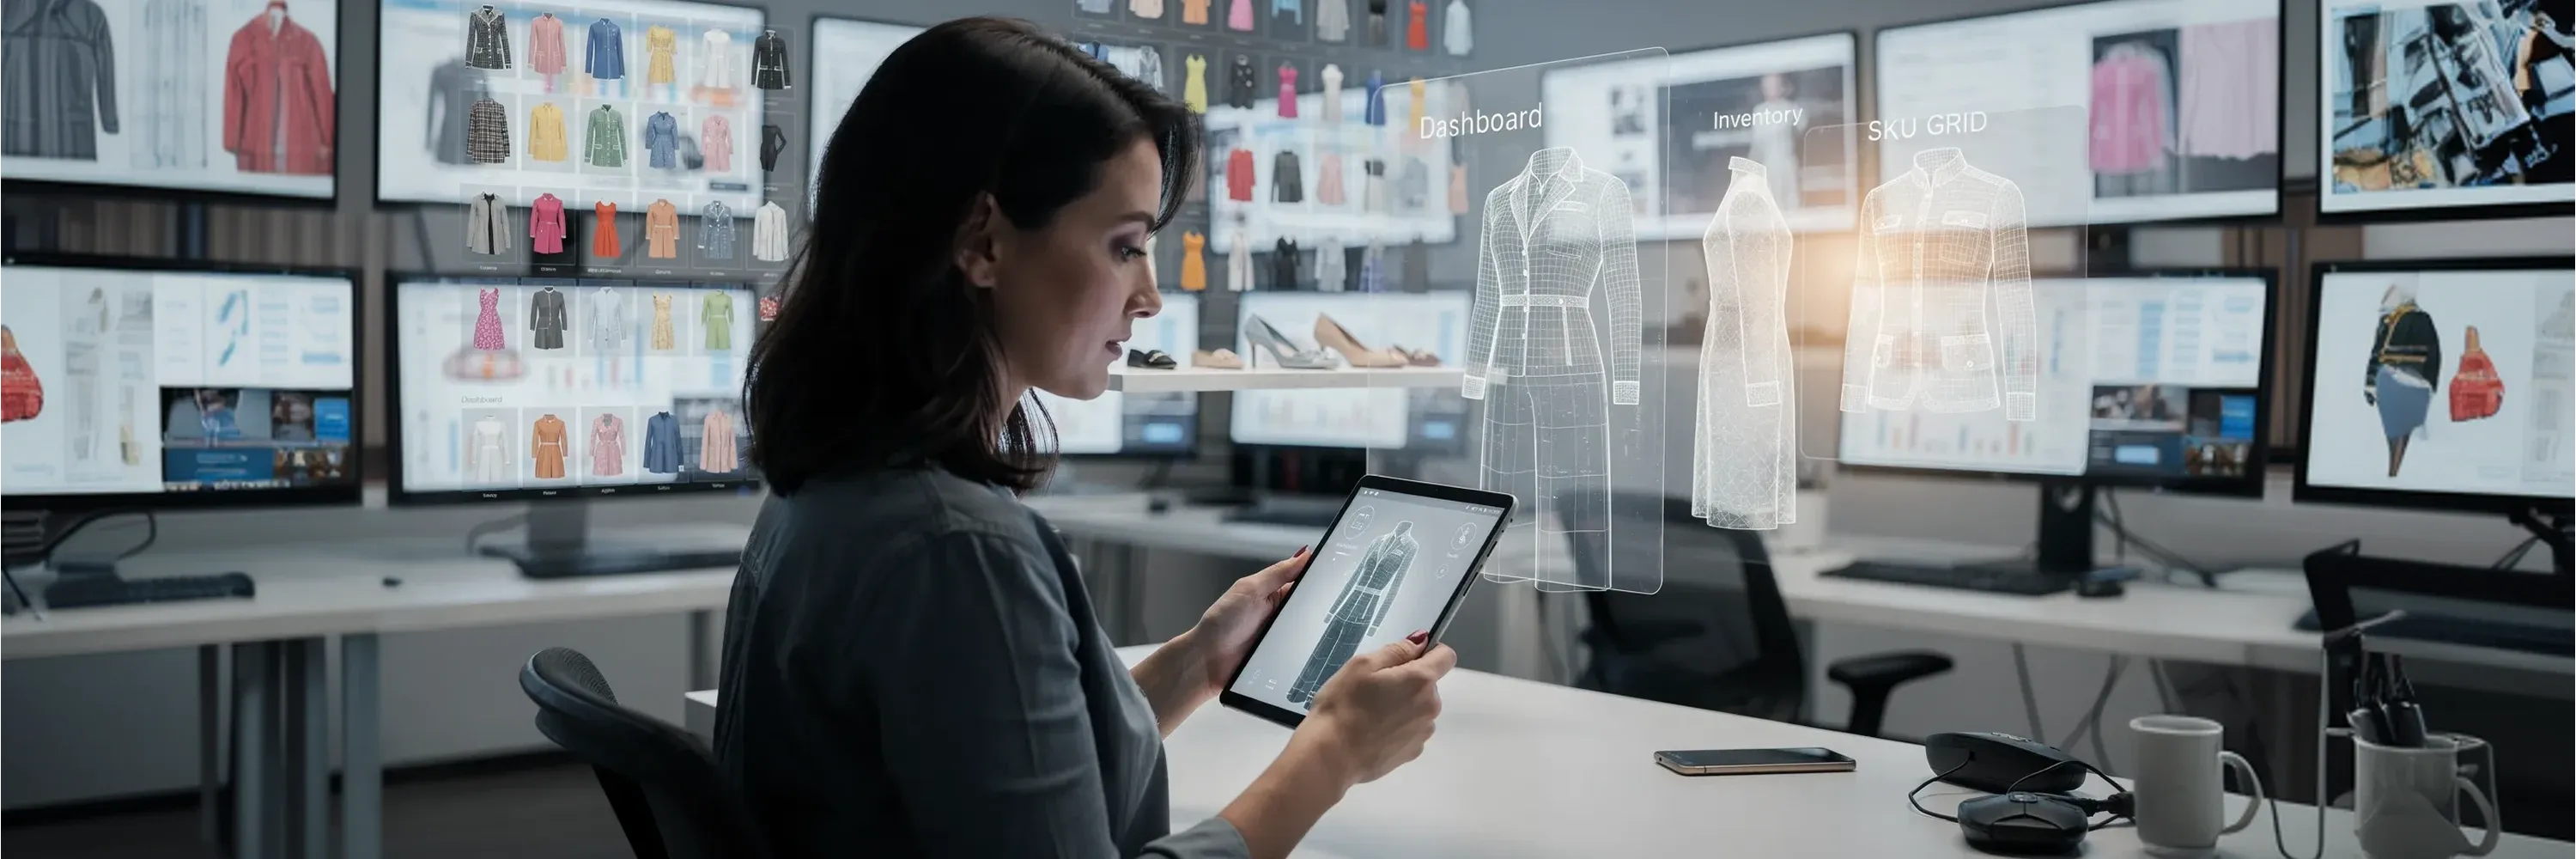
This virtual inventory fails to drive sales if it does not match physical stock. We cannot treat our augmented reality hardware as a standalone island. The in-store AR experience fails immediately if a customer falls in love with a virtual item but discovers at the register that the physical stock ran out hours ago. We must connect the AR software layer directly to our existing Point of Sale (POS) and Inventory Management Systems (IMS) to prevent this friction.
When we link these systems, we ensure that the mirror displays only the products currently available on our shelves. This connection relies on accurate SKU matching between the 3D digital assets and the physical inventory database. For example, the Lightspeed-Shopify integration syncs inventory levels roughly every 30 minutes using unique identifiers to prevent the display of out-of-stock items.
We ensure a reliable connection with these steps:
-
POS API capabilities must support real-time read requests from external devices.
-
Standardized SKU naming conventions across the physical inventory and the 3D digital asset library ensure a unified data structure.
-
A middleware solution buffers requests during peak hours and prevents mirror activity from slowing down checkout operations.
-
The interactive fitting mirror suggests alternative in-stock colors or styles when the primary choice is unavailable.
-
We test the data flow with a specific category, such as a virtual footwear try-on pilot, before rolling it out store-wide.
Shopify reports that a unified commerce approach works better than disjointed third-party integrations for maintaining operational visibility. A smooth data flow between the mirror and the register turns a fun interaction into a confirmed sale. This technical foundation allows us to move from installation to measurement.
Real ROI Measurement
We apply strict criteria during this measurement phase. We define success by financial outcomes rather than engagement metrics. Retail teams often report on "dwell time" or "interaction minutes" to justify technology investments. A customer might spend five minutes making funny faces in a mirror, but this data point does not pay the rent. We track measurable KPIs that prove the hardware generates revenue and protects margins.
The two most critical metrics include "conversion per virtual try-on" and "return rate of AR-interacted products." The first metric tells us how effectively the mirror acts as a sales associate. We track the percentage of sessions that result in a purchase of the tried-on SKU. The impact is often significant. For instance, Estée Lauder reported 2.5x higher conversion for lipstick purchases initiated through AR experiences compared to standard browsing.
The second metric, return rate reduction, validates the mirror's ability to solve the fit and style uncertainty that plagues physical retail. The technology works if customers return products they tried virtually at a lower rate than products they picked off the rack blindly.
We also look at basket size to see if the technology encourages upselling. Data from Clinique shows that a digital mirror increased basket size by 30% and extended dwell time. Even though the extra time in the store is positive, the 30% revenue increase satisfies the CFO. AR mirrors for retail prove their worth when they function as reliable data inputs that correlate directly with higher transaction values and lower operational costs.
Conclusion
These operational improvements confirm the technology's value. To summarize, AR mirrors for retail transitioned from luxury novelties to competitive necessities for modern inventory management. These systems provide value through behavioral data instead of the display itself. This data allows us to predict demand and refine our buying strategies.
WEARFITS handles the 3D asset pipeline that AR mirrors depend on, which converts your existing product photography into accurate digital models without the need for costly CAD teams or manual modeling. Try WEARFITS to close the content bottleneck before it limits your in-store AR rollout.
Frequently asked questions
Quick answers to the questions teams ask most about this topic.
A complete installation typically starts around $20,000 for a fully deployed system. You will pay between $380 and $599 per unit for the display components, while software development adds $5,000 to $15,000. These figures vary depending on whether you choose complex smart glass or simple tablet overlays.
**AR mirrors for retail** reduce return rates by 25% to 40% because they help customers verify fit and style before purchasing. This technology corrects purchase behavior and significantly lowers the volume of costly returns. You protect your bottom line when customers make accurate buying decisions in the store.
You should select hardware based on your specific store traffic and budget availability. High-traffic flagship stores justify the investment in full-length smart glass, while tablet overlays offer a scalable solution for mid-market locations. Tablets use front-facing cameras to deliver the experience without requiring heavy infrastructure changes.
You ensure accuracy by linking the AR software directly to your Point of Sale system. This connection allows the mirror to read real-time inventory levels and hide out-of-stock items automatically. A middleware solution buffers these data requests so that mirror activity does not slow down your checkout operations.
WEARFITS allows you to generate 3D models automatically using their specialized 2D-to-3D converter. You simply provide over 30 studio photographs, and the platform creates realistic assets without requiring CAD files. This solution integrates with your e-commerce channels and physical retail locations to enable accurate virtual try-on experiences.