Virtual shoe fitting ROI: How to calculate costs, savings and payback

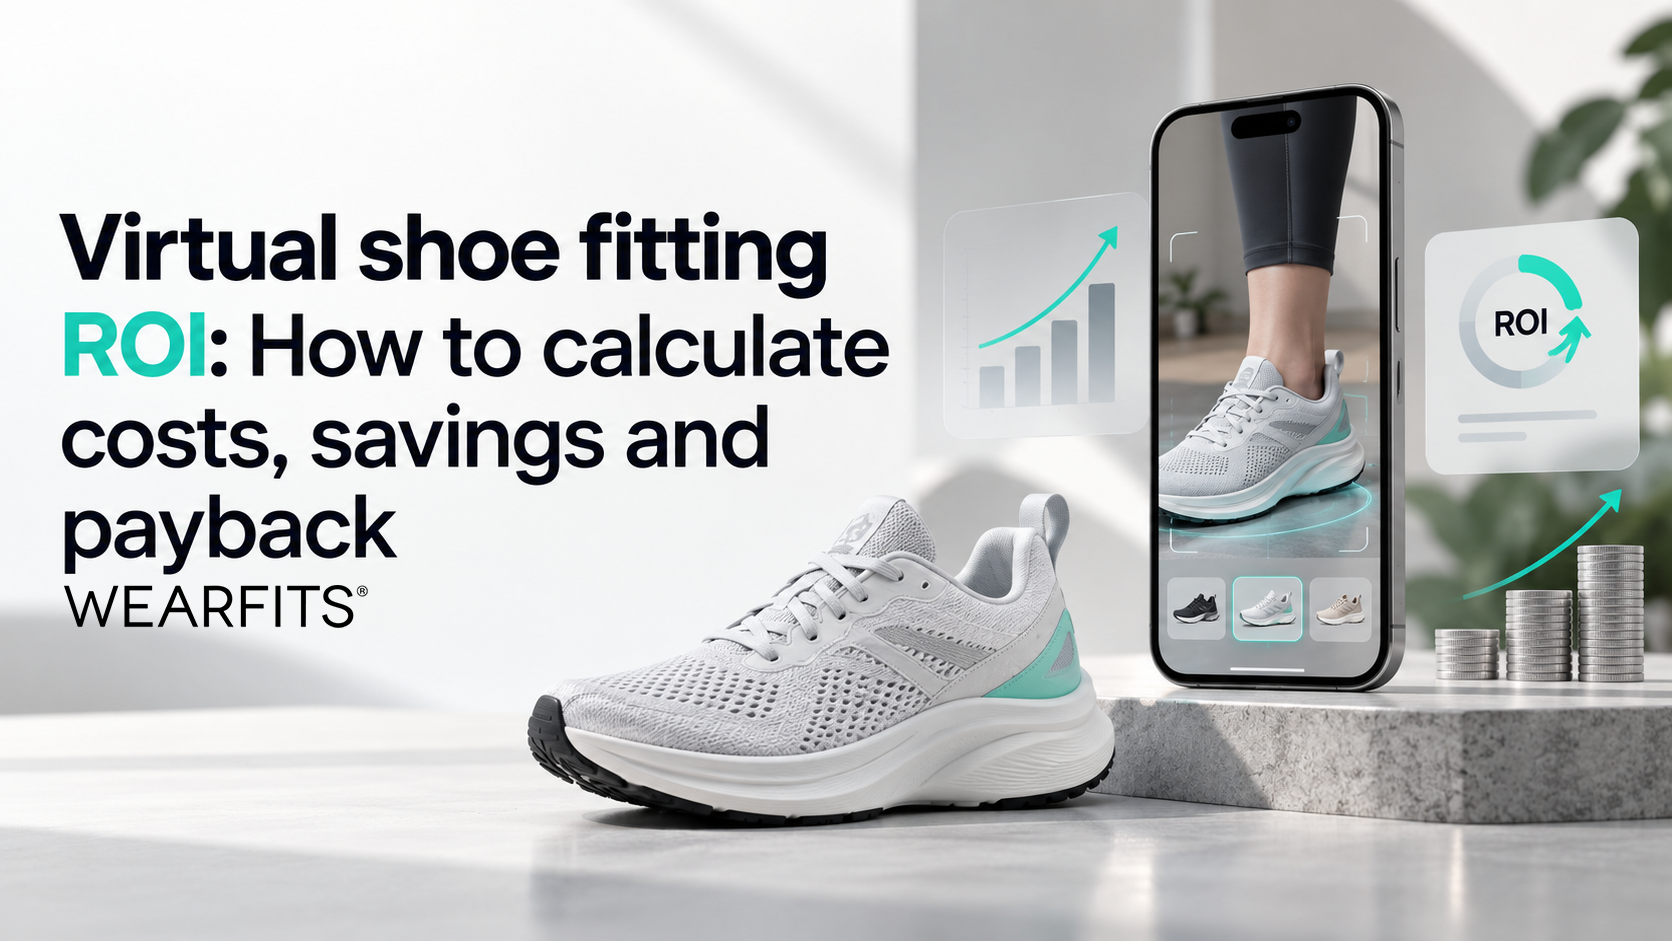
Online footwear retailers face a costly challenge: customers cannot physically try on shoes before buying them. Uncertainty about size, comfort, and appearance can lead to abandoned purchases, incorrect size selections, and expensive returns.
According to the National Retail Federation's 2025 Retail Returns Landscape report, approximately 19.3% of online sales were expected to be returned in 2025. Footwear can face even greater challenges because the right fit depends on more than a standard size chart.
At WEARFITS, we believe that virtual shoe fitting should deliver measurable business value, not simply enhance product presentation. Technologies such as augmented reality (AR), interactive 3D visualization, and digital fit guidance can help shoppers make more confident purchasing decisions.
But how much financial value can these tools generate?
In this guide, we explain how to calculate virtual shoe fitting ROI, identify implementation expenses, estimate savings from fewer returns, and determine when an investment in virtual try-on technology can pay for itself.
Why footwear returns have such a high financial impact
A returned pair of shoes represents more than a refunded transaction. Every return creates additional operational work, increases logistics expenses, and can reduce the profitability of the original sale.
Research published in the International Journal of Physical Distribution & Logistics Management examined footwear return operations and found that poor fit accounted for 55% of returns in the retailer studied.
This makes sizing uncertainty one of the most important problems that footwear e-commerce businesses can address.
When calculating the real cost of a return, retailers should consider several expenses:
- Shipping and transportation: Delivery charges, return labels, and the cost of transporting products back to warehouses.
- Return processing: Staff time required for inspecting shoes, checking their condition, cleaning, sorting, and repackaging.
- Inventory depreciation: Lost selling time, damaged packaging, seasonal markdowns, and reduced resale value.
- Customer service: Resources spent answering sizing questions, processing refunds, and organizing exchanges.
For financial modeling, we can use an illustrative processing cost of 25 per returned order. Actual costs depend on the retailer's logistics arrangements, market, and operating structure.
Reducing unnecessary returns can therefore improve profitability even without increasing website traffic.
What determines the cost of virtual shoe fitting?
Before estimating potential savings, footwear brands need to understand the total investment required.
We recommend calculating the Total Cost of Ownership (TCO) over a 12-month period rather than comparing monthly subscription prices alone.
Three cost categories should be included.
1. Virtual Try-On software subscription
Most virtual shoe fitting providers use SaaS pricing, allowing retailers to pay recurring fees instead of developing proprietary AR infrastructure.
The subscription price typically depends on catalog size, website traffic, monthly virtual try-on sessions, and integration requirements.
For example, smaller stores may need basic 3D product previews, while established footwear brands may require automated model creation, advanced fitting features, and API access.
Enterprise retailers often need additional customization, higher usage limits, and integrations across multiple e-commerce platforms.
WEARFITS offers scalable AR shoe try-on solutions, with plans starting from €49 per month. Businesses can select a configuration that reflects their product range and expected usage.
2. Creating digital 3D shoe models
Preparing 3D assets has traditionally been one of the largest obstacles to implementing augmented reality in footwear retail.
Conventional methods, including manual 3D modeling and photogrammetry, can require specialized equipment, skilled designers, and significant production time.
For large catalogs, the cost of manually digitizing hundreds of products can quickly become substantial.
Modern AI-based workflows offer a more scalable alternative.
With WEARFITS Photo-to-3D technology, brands can transform existing product photographs into interactive digital models without organizing a dedicated 3D photoshoot for every product.
Our virtual try-on setup guide explains how brands can upload shoe images, generate 3D assets, configure AR experiences, and manage their catalog.
This approach can significantly reduce the resources needed to prepare a store for virtual try-on.
3. Integration and ongoing maintenance
Implementation costs depend on the existing e-commerce infrastructure.
For Shopify and WooCommerce stores, dedicated integration options can simplify deployment. Custom platforms may require API connections or a JavaScript-based implementation.
Additional expenses can include initial configuration, quality testing, analytics setup, and ongoing catalog management.
When calculating TCO, include both external provider charges and any internal development or operational costs.
How to calculate virtual shoe fitting ROI
A useful ROI calculation focuses on two financial outcomes: reduced return-related expenses and additional gross profit generated through higher conversions.
These benefits should be measured separately before calculating the combined return on investment.
Formula 1: Savings from prevented returns
Virtual fitting helps customers evaluate products before ordering, potentially reducing purchases that would otherwise result in returns.
The estimated number of avoided returns can be calculated as:
Prevented Returns = Monthly Orders × Return Rate × Fitting Engagement Rate × Return Reduction Rate
Next, calculate the financial benefit:
Monthly Return Savings = Prevented Returns × Average Cost per Return
For example, if a retailer avoids 20 returns per month and each return costs $15 to process, the monthly operational savings equal $300.
The return reduction percentage should ideally come from actual store data or a controlled experiment rather than an assumed industry-wide result.
Formula 2: Additional profit from conversion growth
Interactive product experiences may also influence purchasing decisions.
Customers who can explore footwear in 3D and visualize it using AR may feel more confident about placing an order.
For a simplified forecasting model:
Additional Orders = Monthly Visitors × Baseline Conversion Rate × Engagement Rate × Relative Conversion Lift
To calculate the additional gross profit:
Incremental Gross Profit = Additional Orders × Average Order Value × Gross Margin
The conversion lift must be expressed as a relative percentage. For instance, a 10% relative improvement on a 2% conversion rate increases it to 2.2%, not 12%.
Formula 3: Annual ROI and break-even
After estimating both revenue-related benefits and return savings, calculate the total value:
Monthly Financial Benefit = Return Savings + Incremental Gross Profit
Annual ROI (%) = [(Annual Financial Benefit − Annual TCO) ÷ Annual TCO] × 100
Net Annual Benefit = Annual Financial Benefit − Annual TCO
For a simplified payback estimate:
Payback Period = Total First-Year Investment ÷ Monthly Financial Benefit
This last calculation measures how long it takes gross benefits to recover the total first-year investment. A cash-flow model should instead account for the timing of setup costs and recurring subscription payments.
Virtual shoe fitting ROI example: a mid-sized footwear store
To understand the potential financial return from virtual shoe fitting, let's examine a mid-sized premium footwear retailer offering 100 active shoe models.
The store generates consistent monthly traffic, sells products with healthy margins, and experiences a relatively high return rate typical of fit-sensitive online purchases.
Store performance before virtual fitting
| Business metric | Monthly baseline |
|---|---|
| Website visitors | 100,000 |
| Conversion rate (CVR) | 2.0% |
| Completed orders | 2,000 |
| Average order value (AOV) | €180 |
| Monthly revenue | €360,000 |
| Return rate | 30% |
| Returned orders | 600 |
| Average processing cost per return | €15 |
| Gross margin | 55% |
| Active footwear catalog | 100 SKUs |
With 600 returned orders per month, the retailer spends approximately €9,000 monthly on return processing and logistics alone.
Even relatively small improvements in customer confidence, conversion rates, and return frequency could therefore generate meaningful financial benefits.
WEARFITS Virtual Try-On implementation costs
For this example, we use the actual WEARFITS AR Footwear pricing.
The retailer selects the WEARFITS PRO plan, which costs €1,499 per month and supports up to 100,000 monthly AR try-on interactions, providing sufficient capacity for the estimated customer engagement in both scenarios.
We also include the one-time cost of digitizing the entire 100-product footwear catalog.
| Cost category | Amount |
|---|---|
| WEARFITS PRO subscription | €1,499/month |
| Annual software subscription | €17,988 |
| 3D digitization (100 × €5) | €500 |
| Estimated one-time integration budget | €300 |
| Total first-year investment | €18,788 |
The subscription and digitization prices reflect published WEARFITS pricing. The €300 integration budget is an illustrative assumption, not a standard published implementation charge. This model uses monthly billing without an annual subscription discount. The €500 price is estimated and may vary depending on products.
The investment covers the first year of software usage, one-time 3D asset production, and the assumed initial integration expense.
We can now evaluate two potential performance scenarios.
Virtual shoe fitting ROI: illustrative assumptions and results
These scenarios use illustrative assumptions, not measured WEARFITS customer results. They show how different adoption and performance levels affect projected ROI. Replace these inputs with your store’s test results.
Assumptions and monthly calculations
Both scenarios use the same store baseline above: 100,000 monthly visitors, a 2% conversion rate, a €180 average order value, a 55% gross margin, a 30% return rate and a €15 processing cost per return. For this simplified illustration, the try-on engagement rate is also applied to baseline orders when estimating avoided returns. All uplift and reduction percentages below are relative changes within the engaged group.
| Assumption / result | Illustrative scenario A | Illustrative scenario B |
|---|---|---|
| Visitors using virtual try-on | 20% | 35% |
| Relative conversion lift among engaged visitors | 10% | 20% |
| Relative return reduction among engaged orders | 15% | 25% |
| Additional orders per month | 40 | 140 |
| Incremental gross profit per month | €3,960 | €13,860 |
| Avoided returns per month (average) | 18 | 52.5 |
| Return savings per month | €270 | €787.50 |
| Total annual financial benefit | €50,760 | €175,770 |
For example, scenario A produces 100,000 × 2% × 20% × 10% = 40 additional orders per month. At €180 per order and a 55% gross margin, this equals €3,960 in incremental monthly gross profit. Avoided returns equal 2,000 × 30% × 20% × 15% = 18 per month, saving 18 × €15 = €270. The total annual financial benefit is (€3,960 + €270) × 12 = €50,760.
Fractional avoided returns represent a monthly average over time, rather than part of an individual return.
Projected annual ROI and payback
| Metric | Illustrative scenario A | Illustrative scenario B |
|---|---|---|
| Annual financial benefit | €50,760 | €175,770 |
| First-year investment | €18,788 | €18,788 |
| Net annual benefit | €31,972 | €156,982 |
| Annual ROI | 170.2% | 835.5% |
| Break-even period | 4.4 months | 1.3 months |
Both scenarios demonstrate how virtual shoe fitting can become a profitable investment for footwear e-commerce businesses.
Importantly, the projections include the actual WEARFITS PRO subscription and the upfront digitization cost of the entire footwear catalog.
The model also shows that conversion improvements are responsible for most of the projected financial benefit, while reduced returns provide additional operational savings.
These results are illustrative financial scenarios, not guaranteed outcomes or measured WEARFITS customer performance. The assumptions should be validated through real engagement, conversion, and return data. Actual profitability will also depend on product margins, customer acquisition expenses, incremental order fulfillment costs, and how many try-on interactions each engaged visitor generates.
For footwear brands, the key opportunity is to transform virtual try-on from a visual shopping feature into a measurable driver of e-commerce profitability.
Additional business benefits of Virtual Shoe Try-On
The financial value of virtual shoe fitting extends beyond immediate logistics savings and sales growth.
Improved customer acquisition efficiency
When a store converts more visitors into customers, it can generate additional sales from existing marketing traffic.
This may improve return on advertising spend (ROAS) and reduce effective customer acquisition costs (CAC), provided advertising expenditure remains stable.
Stronger customer confidence and loyalty
A positive shopping experience helps establish trust. Customers who receive products that match their expectations may be more willing to purchase from the same retailer again.
Virtual try-on also makes product discovery more interactive and engaging, supporting a more memorable digital shopping experience.
Better product and sizing insights
Customer engagement data can reveal which products attract the most virtual try-ons, where shoppers hesitate, and how different shoe styles perform.
When combined with reliable sizing and return information, these insights can help retailers improve product descriptions, inventory decisions, and fit recommendations.
Potential environmental benefits
Returns also create an environmental burden through additional transportation, packaging, handling, and sometimes product disposal.
The European Environment Agency highlights the environmental challenges associated with online fashion returns.
By helping shoppers make better-informed decisions, virtual fitting may contribute to fewer unnecessary shipments and a more resource-efficient retail model.
How WEARFITS makes virtual shoe fitting more accessible
At WEARFITS, our objective is to help footwear brands introduce engaging digital product experiences without the complexity traditionally associated with 3D commerce.
Our technology supports interactive shoe visualization, augmented reality try-on, and the creation of digital product assets from existing photographs.
Using the WEARFITS dashboard, retailers can manage products, generate 3D previews, and publish experiences that customers can access through compatible devices.
For businesses looking to expand, API integration provides additional flexibility across different e-commerce environments.
The process is explained in our guide to setting up virtual try-on for shoes and bags.
By simplifying content production and deployment, we help brands focus on what matters most: improving the shopping experience and measuring its commercial impact.
How to measure ROI after launch
Forecasting is only the first step. Once virtual fitting is implemented, retailers should compare performance before and after deployment, ideally using an A/B test.
Important metrics include virtual try-on engagement, conversion rate, return frequency, reasons for returns, average order value, and the total cost of operating the technology.
It is particularly important to compare similar customer groups. Shoppers who voluntarily use AR try-on may already have stronger purchase intent, so their higher conversion rate does not automatically prove that the technology caused the improvement.
A controlled test helps separate the effect of virtual fitting from promotional campaigns, seasonal demand, or changes in product selection.
We recommend evaluating results over a meaningful period and updating ROI projections with actual store data.
Conclusion: Is virtual shoe fitting worth the investment?
Virtual shoe fitting is increasingly relevant for footwear retailers seeking to reduce uncertainty and improve online shopping performance.
Its business value depends on how effectively the technology improves customer decisions, reduces avoidable returns, and contributes to profitable sales.
Our calculations show that even relatively modest improvements can potentially generate a positive financial return when implementation costs remain manageable. However, actual ROI will vary according to store traffic, product margins, return behavior, customer adoption, and implementation costs.
At WEARFITS, we make it easier to turn traditional footwear product pages into interactive 3D and AR shopping experiences.
Explore our WEARFITS virtual shoe try-on technology and discover how your brand can build a more engaging, data-driven, and efficient footwear e-commerce experience.
Related posts
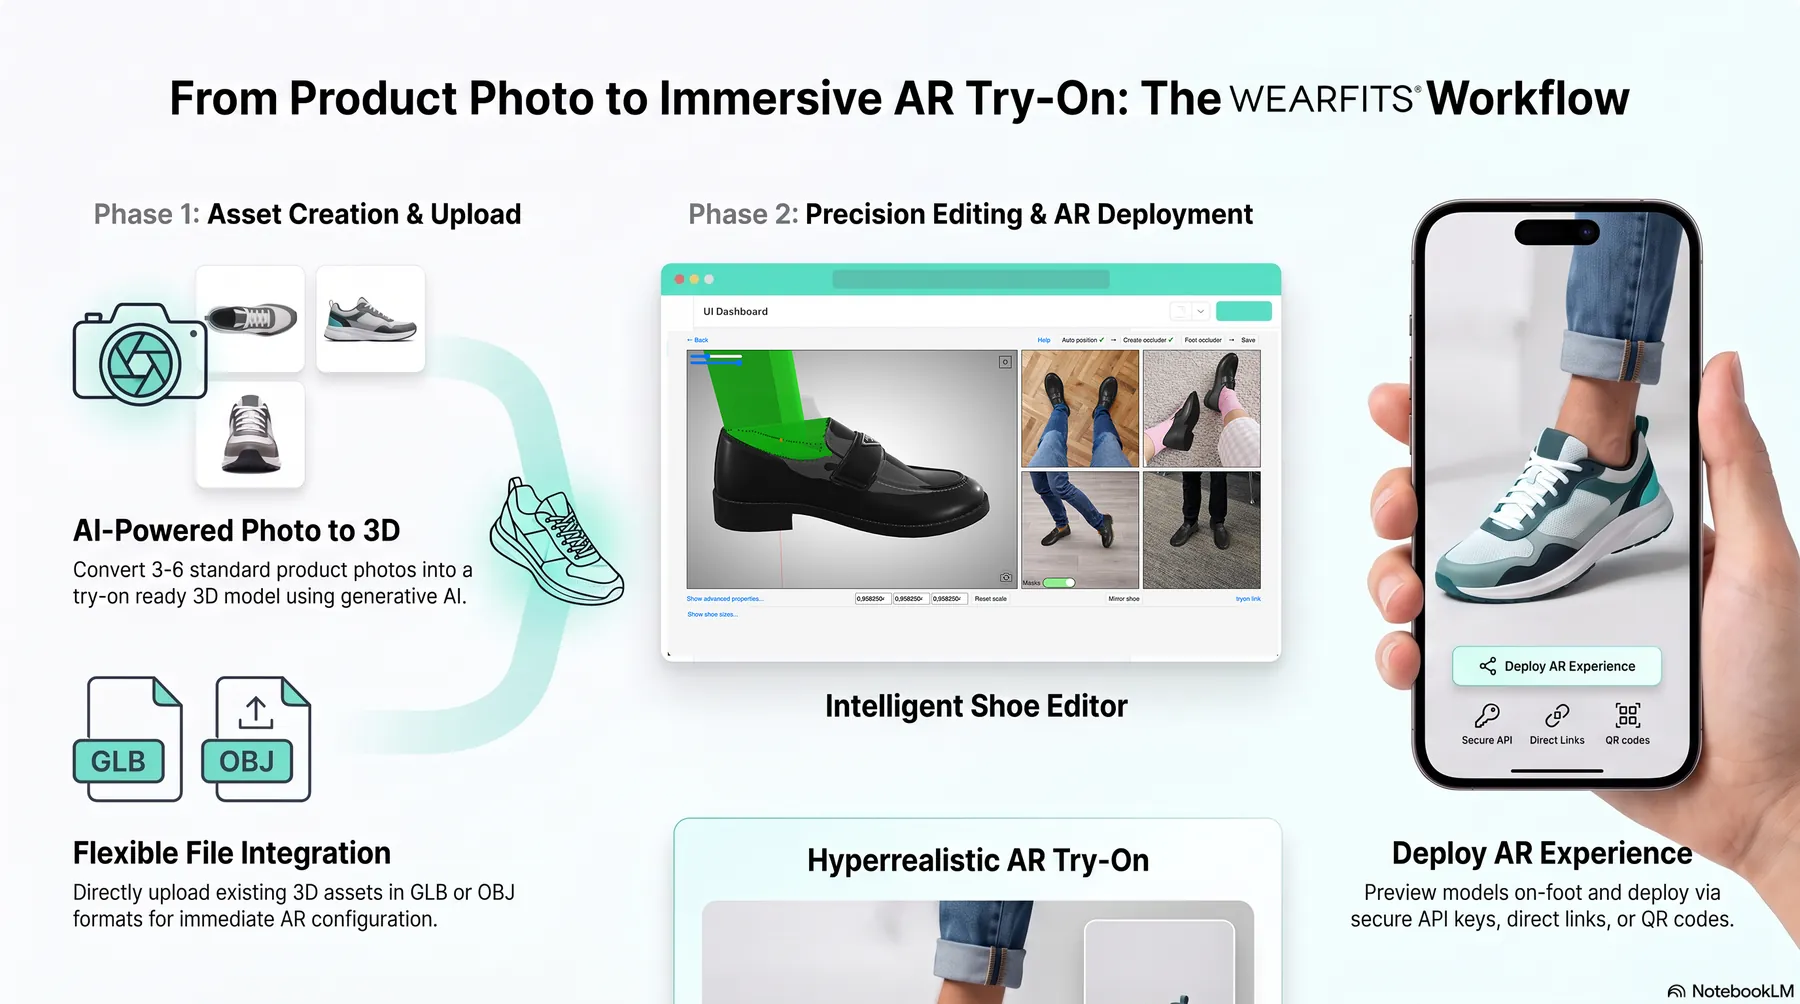
How to Set Up Virtual Try-On for Shoes and Bags: A Complete WEARFITS SaaS Dashboard Guide
Why Footwear Returns Need More Than Better Sizing: Solving the “Fit vs. Look” Problem

How to Choose the Right Virtual Try-On Plan for an Online Store with 10,000 Monthly Visits and 600 SKUs
