Per-SKU Fit Heatmaps: Cut Shoe Returns & Boost Conversion

Online footwear shopping has improved dramatically over the past decade, yet one problem continues to damage margins, customer satisfaction, and inventory efficiency: poor fit.
Traditional size charts were designed to simplify online shoe shopping by translating sizes across regions and brands. In practice, however, they provide only a rough approximation of whether a specific shoe will fit a specific customer. A shopper may know that they usually wear a US 9, UK 8, or EU 42, but that information says very little about how a particular sneaker, running shoe, boot, or heel will feel on their foot.
This gap between nominal shoe size and actual physical fit is one of the main reasons footwear e-commerce continues to experience unusually high return rates.
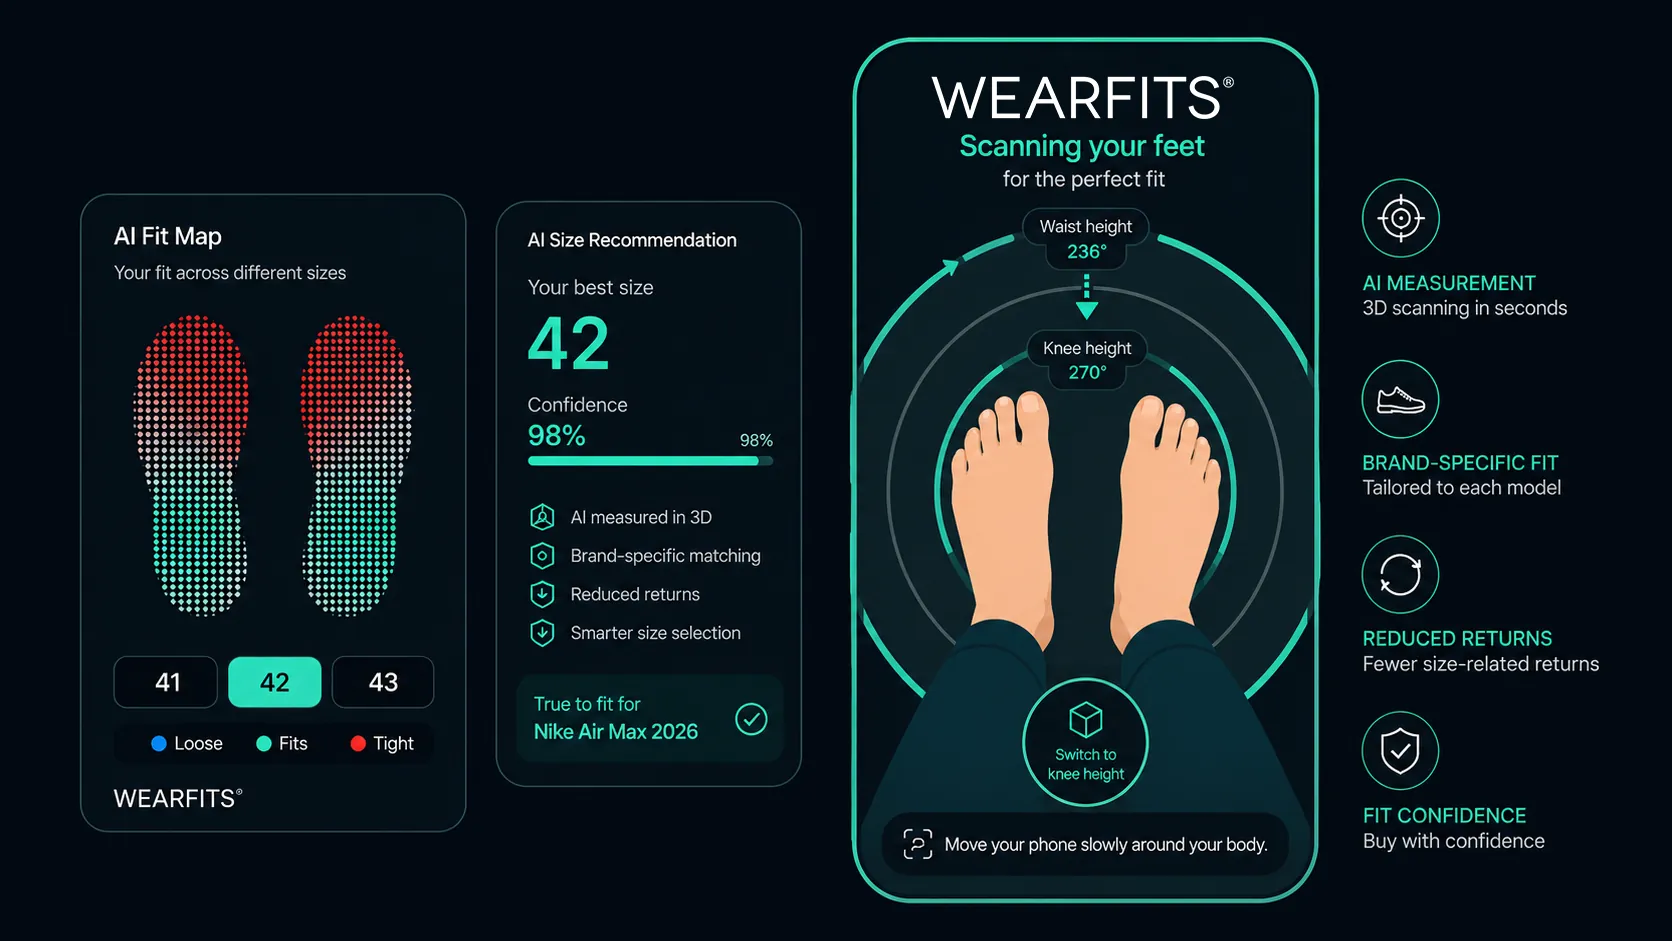
The next generation of online footwear fitting technology addresses the problem differently. Instead of asking customers to trust a generic conversion table, advanced platforms combine precise foot measurement, SKU-specific shoe geometry, augmented reality, and real-time pressure visualization.
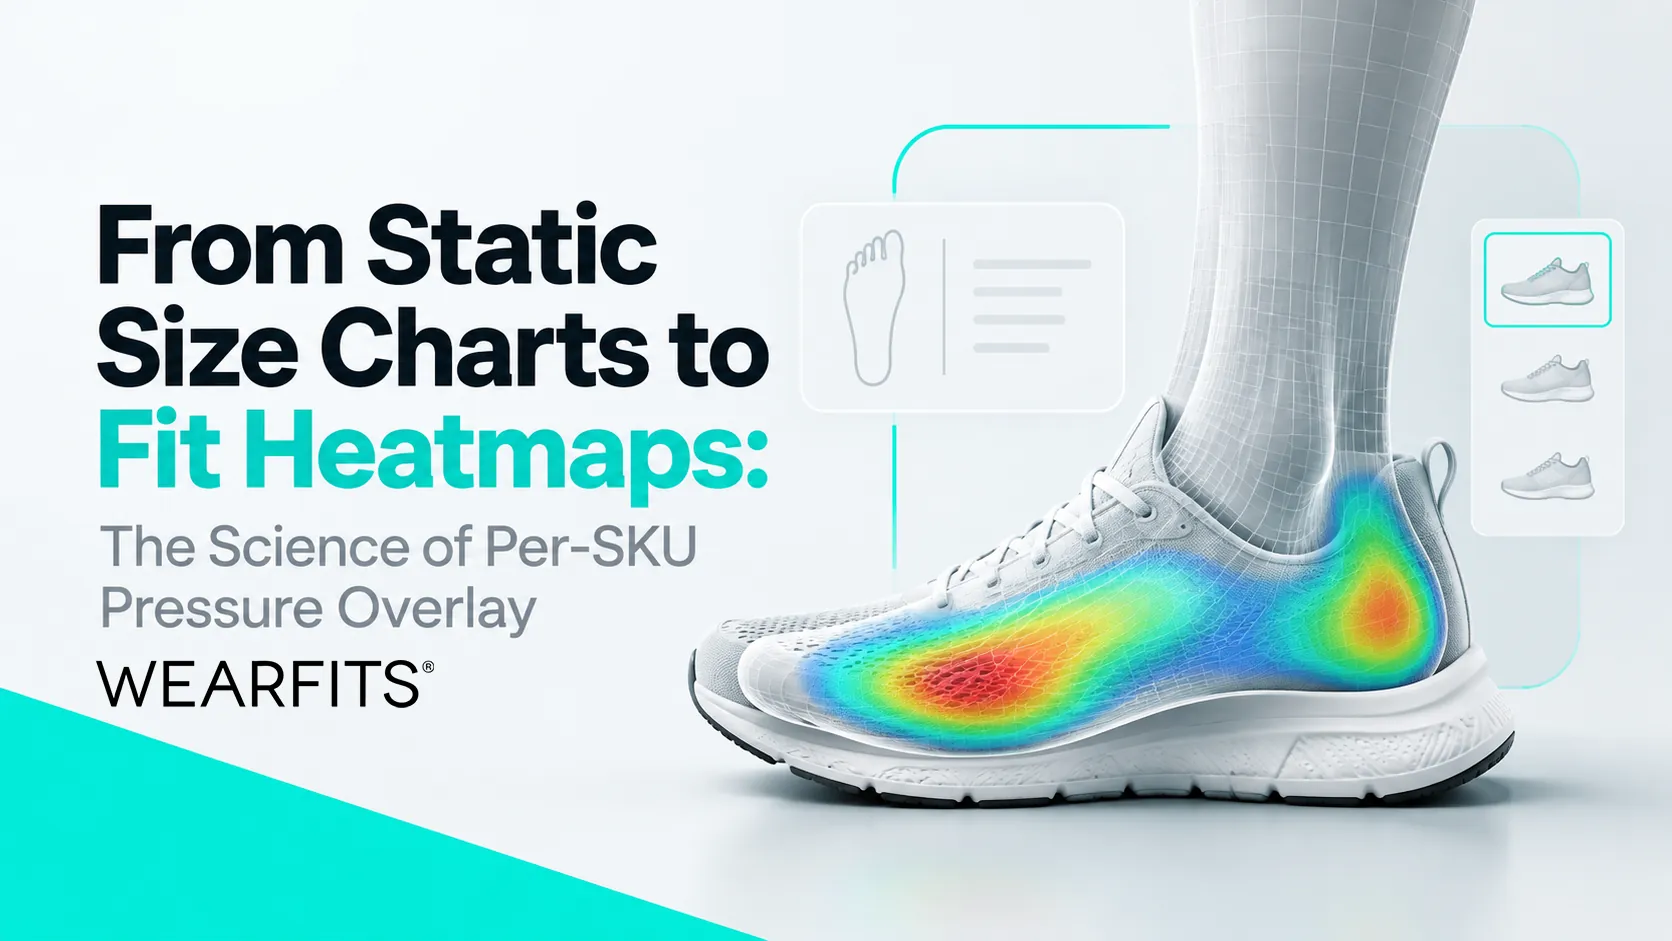
The result is a new category of fitting experience: the per-SKU pressure heatmap.
Why Static Shoe Size Charts Create Expensive Returns
Footwear is one of the most difficult product categories to sell online because shoppers cannot physically try the product before purchasing it.
Return rates in online footwear frequently range between 20% and 35%, with seasonal peaks around major shopping periods. Across the wider U.S. retail market, returns reached hundreds of billions of dollars in 2024, creating enormous pressure on logistics networks and retailer margins.
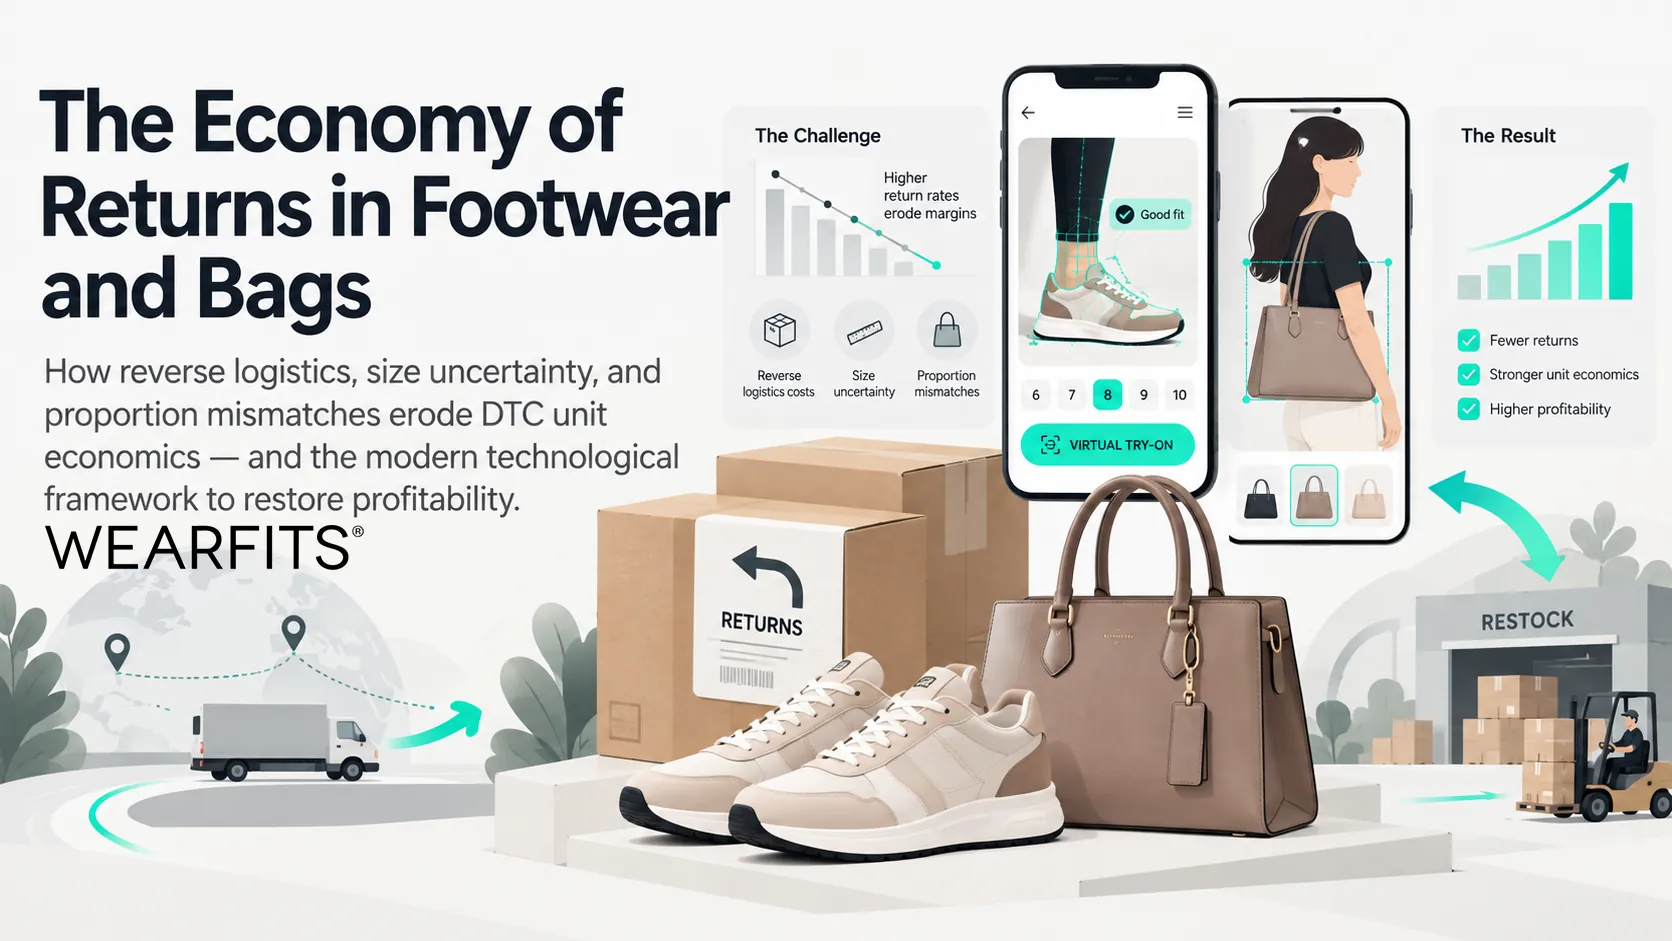
Every footwear return generates costs that extend far beyond the refund itself. Retailers may need to pay for return shipping, warehouse processing, product inspection, cleaning, repackaging, restocking, markdowns, and customer support. Depending on the business model, reverse logistics expenses can reach $15 to $25 per parcel and may consume a significant percentage of the original product value.
For footwear brands, one of the biggest underlying causes is incorrect fit.
However, traditional return reporting often combines multiple customer complaints into broad categories such as "size," "fit," or "style." In reality, two very different problems are usually involved.
The first is a physical sizing failure. The customer chooses the size that appears correct on the website, but the shoe feels uncomfortable. The toe box may be too narrow, the heel may slip, the instep may feel compressed, or the overall internal volume may not match the shopper's foot.
The second is a visual or style mismatch. In this situation, the shoe technically fits, but the customer dislikes how it looks when worn. The proportions may appear different on their own foot compared with product photography, campaign imagery, or model shots.
Traditional size charts attempt to solve only the first problem, and even there their effectiveness is limited.
Why Traditional Shoe Size Guides Are Not Accurate Enough
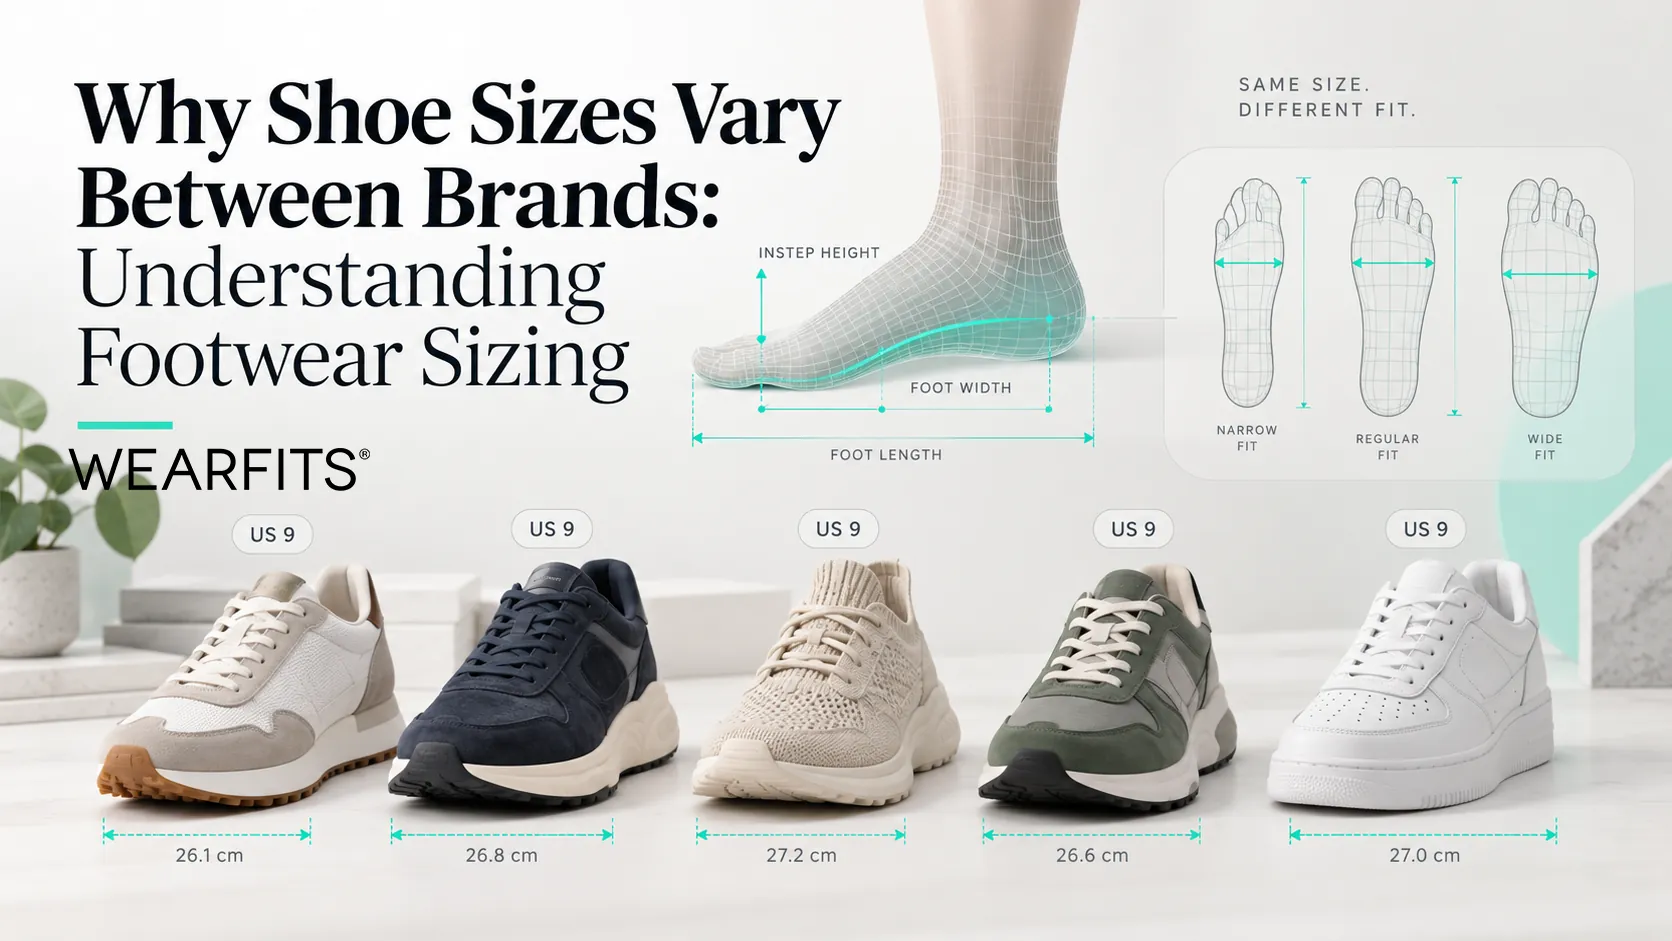
Most online shoe size charts rely on static two-dimensional conversion tables. A customer sees a relationship such as US 9 equals UK 8 or EU 42 and assumes that the equivalent size will provide the expected fit.
The difficulty is that footwear sizing is not universally standardized.
A women's US size 8 from one manufacturer can have a noticeably different internal length from a size 8 produced by another company. Differences of several millimeters can significantly affect comfort, particularly in performance footwear or narrow-fitting silhouettes.
Variation also exists within the same brand.
A running shoe, lifestyle sneaker, court shoe, hiking boot, and high heel may all carry the same printed size while being constructed around very different internal shapes. Materials, padding, toe-box structure, heel geometry, and intended use can all change the way the product fits.
Static shoe size charts also describe the foot too simplistically.
Most charts focus mainly on foot length and, occasionally, basic width. Human feet are three-dimensional structures. Comfortable fit depends on additional variables such as ball girth, instep height, arch shape, forefoot volume, and the relationship between different parts of the foot.
As a result, simply knowing foot length is rarely sufficient to predict whether an individual SKU will feel comfortable.
Shopper behavior reflects this lack of confidence. Only a relatively small percentage of consumers actively open traditional size charts, while many continue relying on their usual shoe size, previous purchases, reviews, or guesswork.
When uncertainty remains, shoppers often use a strategy known as bracketing.
Bracketing Turns the Customer's Home Into a Fitting Room
Bracketing happens when a customer orders several sizes or variations of the same product with the intention of returning the options that do not fit.
From the shopper's perspective, this makes sense. If they are unsure whether they need a size 42 or 42.5, ordering both reduces the risk of ending up with an unusable product.
For the retailer, however, bracketing is extremely expensive.
Instead of shipping one item and completing one successful transaction, the company may ship two or three products while already expecting one or more of them to come back.
That creates additional outbound shipping costs, reverse logistics expenses, warehouse handling, inventory delays, and increased risk that returned merchandise can no longer be sold at full price.
It also locks valuable inventory outside the warehouse during periods when demand may be highest.
Solving footwear fit before checkout therefore has a direct financial impact. The goal is not simply to make the Product Detail Page more interactive. The goal is to reduce uncertainty before the customer places the order.
Modern fit technology must answer two questions:
Will this specific shoe fit my foot?
And:
What will this specific shoe look like on me?
Earlier generations of footwear technology typically solved only one side of the problem. Sizing systems focused on measurement and recommendations, while augmented reality tools concentrated on visualization.
Per-SKU pressure overlays combine both.
How Per-SKU Pressure Heatmaps Work
Advanced virtual footwear fitting can be understood as a three-layer architecture. Each layer contributes a different part of the fit prediction process.
The first layer measures the customer's foot. The second analyzes the internal geometry of the individual shoe. The third converts that relationship into a visual pressure map that shoppers can understand immediately.
Layer 1: AI-Powered 3D and 5D Foot Measurement
The process begins with smartphone-based foot scanning.
Instead of requiring specialist hardware, dedicated scanners, or depth sensors, modern computer-vision systems can operate through standard iOS and Android cameras.
A guided scan typically takes less than a minute.
Using convolutional neural networks and 3D reconstruction techniques, the system analyzes captured images and generates a digital representation of the shopper's foot.
More advanced systems go beyond simple length and width measurements. They may estimate several biometric dimensions that influence footwear comfort, including:
- total foot length,
- ball width,
- ball girth,
- instep height,
- arch profile,
- overall foot volume.
This creates a much more useful representation of fit than a conventional size number.
Instead of describing the customer as someone who "wears EU 42," the platform can describe the geometry of that person's foot.
Edge AI can also process measurement data directly on the user's mobile device. This approach can reduce latency, improve responsiveness, and limit the amount of biometric information that needs to be transferred to remote infrastructure.
High-quality scanning systems can achieve measurement precision close to professional footwear fitting tools, with errors measured in only a few millimeters.
However, accurately measuring the foot is only half of the equation.
The platform must also understand the shoe.
Layer 2: Per-SKU Shoe Last Geometry
Every shoe is built around an internal form commonly known as a shoe last.
The last determines essential aspects of the product's fit, including toe shape, heel structure, internal width, curvature, instep clearance, and overall volume.
This explains why two shoes labeled with exactly the same size can feel completely different.
A running shoe may provide additional forefoot room. A court sneaker may prioritize lateral stability. A fashion shoe may use a narrower toe profile. A high heel redistributes the foot differently again.
Generic size recommendations cannot fully account for these differences.
Per-SKU fitting systems solve the problem by analyzing the geometry of the actual product rather than relying only on brand-level size tables.
The shopper's digital foot model is compared with the internal three-dimensional geometry of the specific SKU being viewed.
That distinction is essential.
The system is no longer asking:
"What size does this customer usually wear?"
Instead, it is asking:
"How does this customer's foot interact with this exact shoe in this exact size?"
This changes sizing from a broad statistical recommendation into a geometric matching problem.
Modern AI-based product digitization can also reduce dependence on manufacturer CAD files. In some workflows, three-dimensional product geometry can be reconstructed or estimated using standard product photography and existing footwear specifications.
That makes SKU-level implementation more practical for large e-commerce catalogs.
Layer 3: Real-Time Pressure Heatmap Visualization
Raw measurements are useful for algorithms, but they are not particularly intuitive for consumers.
Most shoppers do not want to interpret statements such as "4.3 millimeters of lateral clearance" or compare multiple technical dimensions.
Pressure heatmaps translate complex fit calculations into a simple visual language.
The platform overlays a thermal-style map onto a three-dimensional or augmented-reality representation of the shoe.
Different colors communicate different levels of fit pressure. This format allows shoppers to understand fit almost instantly.
Instead of being told that one size is recommended, the customer can see why.
For example, a size EU 42 may display red pressure around the forefoot and instep. Switching to EU 42.5 can instantly recalculate the visualization and show those zones changing to green.
This creates a much stronger sense of confidence than a text message saying "We recommend size 42.5."
Why Combining AR, Fit Data, and Pressure Visualization Matters
Virtual try-on technology has traditionally focused on appearance.
An augmented reality shoe experience might place a digital sneaker over the customer's foot through the smartphone camera. This helps answer whether the product looks attractive, but it does not necessarily reveal whether the shoe will be comfortable.
Sizing engines have traditionally done the opposite.
They may recommend a size based on previous purchases, survey answers, foot measurements, or crowdsourced information. However, the recommendation is often delivered as text with limited explanation.
A unified fitting interface combines both experiences.
The shopper sees the shoe, receives SKU-specific sizing guidance, and understands where pressure may occur within one digital environment.
This is especially powerful when combined with an interactive size selector.
A customer can move between adjacent sizes in real time and watch the fit map change. Instead of repeatedly consulting charts or reviews, they can visually compare how size 42, 42.5, and 43 interact with their own foot geometry.
That reduces purchase uncertainty at the exact moment when the buying decision is being made.
Static Size Charts vs Fit Quizzes vs Per-SKU Pressure Heatmaps
The evolution of footwear sizing technology can be divided into several generations.
Static size charts represent the earliest model. They use fixed tables and usually consider only basic dimensions such as length and width. They are inexpensive to deploy but provide limited SKU-specific guidance.
Fit quizzes and recommendation widgets introduced a more personalized layer. They may ask shoppers which brands they currently wear, whether those shoes feel tight or loose, and which size they usually purchase.
These tools can improve recommendations, but they still depend heavily on self-reported or crowdsourced information.
Per-SKU pressure heatmaps introduce direct biometric and geometric analysis.
Instead of asking customers to estimate their fit preferences, the system measures the foot. Instead of assuming every product within a brand fits similarly, it evaluates the specific SKU.
The customer can then verify the recommendation visually through a real-time pressure overlay.
This combination creates the potential for significantly higher fitting accuracy, stronger shopper engagement, fewer sizing-related returns, and lower dependence on bracketing.
The Financial Impact of Better Footwear Fit Technology
Per-SKU pressure visualization should not be viewed only as an augmented reality feature or marketing enhancement.
Its strongest business case is contribution margin.
Consider a direct-to-consumer footwear company processing 10,000 orders per month with an average order value of $130.
At a 20% return rate, approximately 2,000 pairs are returned every month.
If reverse logistics cost an average of $21 per returned pair, the company spends about $42,000 every month simply processing returns. That represents approximately $504,000 per year before considering markdowns, lost inventory availability, customer service costs, or damaged packaging.
If sizing problems account for 75% of returns, around 1,500 monthly returns are related directly to fit.
Reducing sizing-related returns by just 20% would prevent roughly 300 returns each month.
At $21 in direct reverse-logistics cost per return, that represents approximately $6,300 in monthly savings, or more than $75,000 per year.
The financial upside can become even larger when conversion is included.
Shoppers frequently abandon purchases because they are uncertain about sizing. If a fit visualization removes that uncertainty, Product Detail Page conversion can improve among customers who engage with the technology.
That means the same fitting system can potentially influence both sides of the profitability equation: lowering return costs while increasing completed purchases.
How E-Commerce Teams Can Implement Per-SKU Fit Heatmaps
A successful rollout does not require digitizing an entire footwear catalog immediately.
The most effective approach is often to begin with the SKUs creating the largest commercial problem.
Start by identifying approximately 50 high-volume products with the highest levels of size-related returns. Establish a clear baseline using historical return data, size exchanges, conversion rates, and customer-service complaints.
A 60- to 90-day baseline provides a useful comparison period for measuring performance after implementation.
The next priority should be frictionless access.
Foot scanning and pressure visualization should work directly in the mobile browser whenever possible. Requiring customers to download a separate application introduces another step into the purchase journey and can reduce adoption.
Web-first deployment through an e-commerce platform integration, Shopify application, SDK, or REST API can make the fitting experience accessible directly from the Product Detail Page.
Placement also matters.
The fit experience should not be hidden behind secondary menus or support pages. Integrating the AR view and pressure heatmap near the size selector gives customers access at the moment when sizing uncertainty is highest.
Finally, teams should track detailed funnel behavior.
Useful events may include scan completion, heatmap activation, size switching, fit confirmation, add-to-cart activity, conversion, exchanges, and returns.
Connecting these events makes it possible to determine whether the technology is improving engagement, reducing bracketing, increasing conversion, or preventing sizing-related returns.
The Future of Online Footwear Sizing
The future of footwear e-commerce is moving beyond generic size recommendations.
Static charts treat shoe size as a universal label. Modern fitting systems treat fit as a relationship between two three-dimensional objects: the customer's foot and the internal geometry of an individual shoe.
That shift is important because consumers do not experience footwear as a number on a box.
They experience pressure at the toe, movement at the heel, compression around the instep, space around the arch, and the overall appearance of the shoe on their foot.
Per-SKU pressure heatmaps translate those physical relationships into something shoppers can understand before purchasing.
By combining AI-powered foot scanning, SKU-level last geometry, augmented reality, and visual pressure mapping, footwear retailers can move from generic sizing advice toward individualized fit simulation.
For customers, the benefit is greater confidence.
For retailers, the opportunity is fewer returns, less bracketing, stronger Product Detail Page conversion, lower reverse-logistics costs, and more efficient inventory utilization.
Static shoe size charts are unlikely to disappear overnight, but their role is becoming increasingly limited. As online footwear technology evolves, the competitive advantage will come from systems that do more than tell shoppers which size to choose.
They will show them how the shoe is likely to fit before it ever arrives at their door.